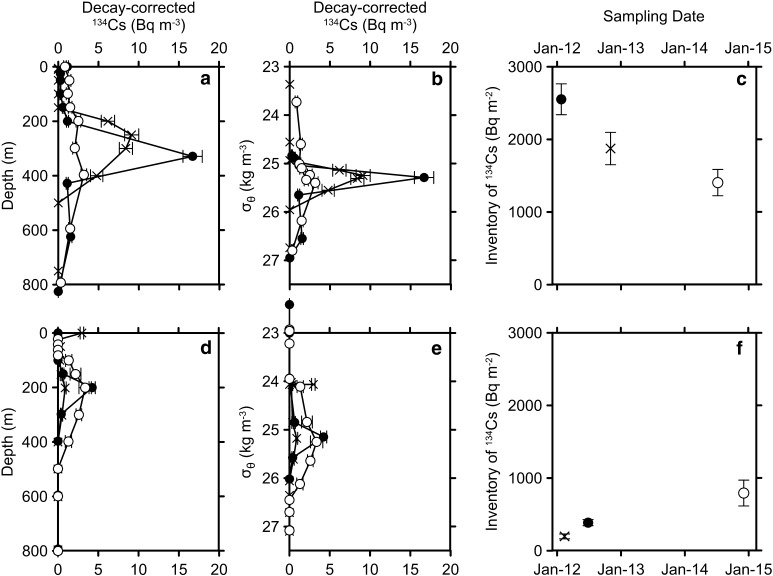
Fig. 5.
Activity concentrations of 134Cs (Bq m−3) against sampling depth (a) and water density anomaly, σ θ (b), and temporal change in 134Cs vertical inventory from surface to 800 m depth (c, Bq m−2) at stations in 34°N/147–150°E in January 2012 (closed circles [41]), November 2012 (crosses [33]), and July 2014 (open circles). Error bars in c indicate uncertainty (one standard deviation or 68 % confidence level) of the vertical inventory, about 10 %. d, e, f are same as a, b, c, respectively, but for at stations in 23–24°N/165°E in February 2012 (crosses [30]), June 2012 (closed circles [30]), and December 2014 (open circles). The activity concentration and vertical inventory were corrected to 11 March 2011

