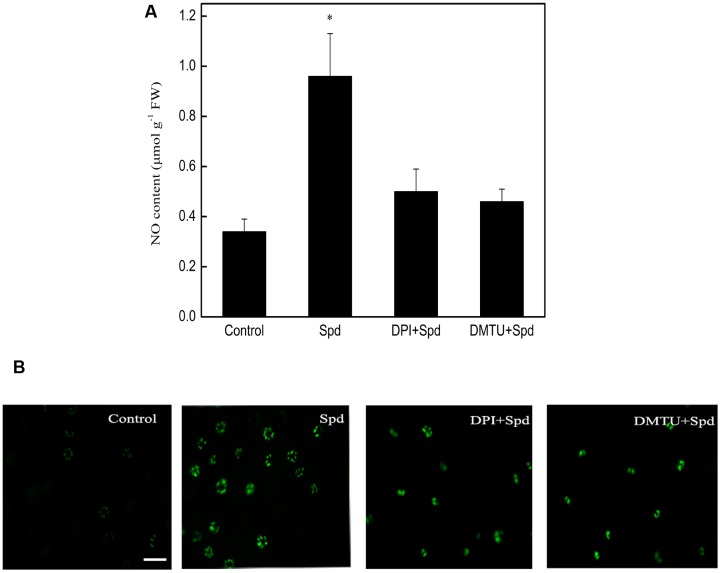
FIGURE 3.
Effect of DPI and DMTU on Spd-induced NO production in the leaves of tomato under chilling stress (4°C, 24 h). (A) NO content, (B) fluorescence imagines of NO. Scale bar for NO accumulation represents 60 μM. Four treatments were used: (1) control; (2) 1 mM Spd; (3) 100 μM DPI+1 mM Spd; (4) 5 mM DMTU+1 mM Spd. Data represent the mean ± SE of three independent experiments and asterisks represent significant differences compared to control at P ≤ 0.05 according to Duncan’s multiple range test.

