
Fig. 4.
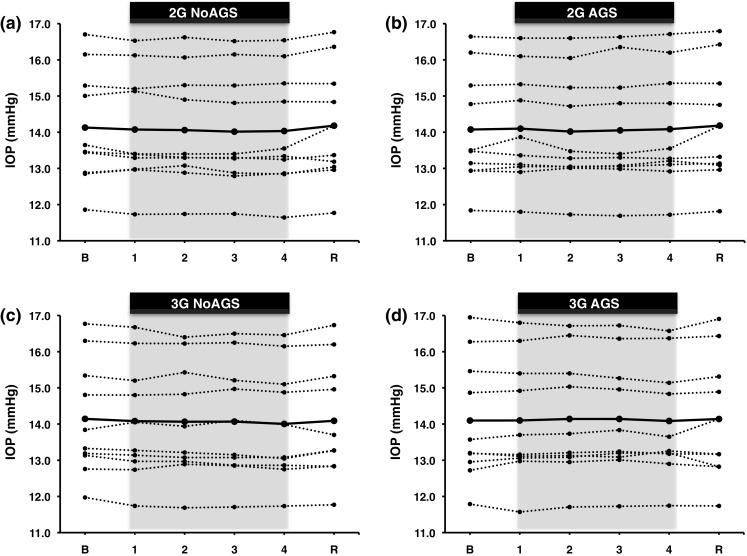
Individual mean values, and group averages (bold curves), of intraocular pressure (IOP) obtained during the 4-min G plateaux at 2 and 3 G, and the 3-min recovery with (AGS) and without (NoAGS) anti-G-suit pressurised. B baseline phase, R recovery phase. n = 10