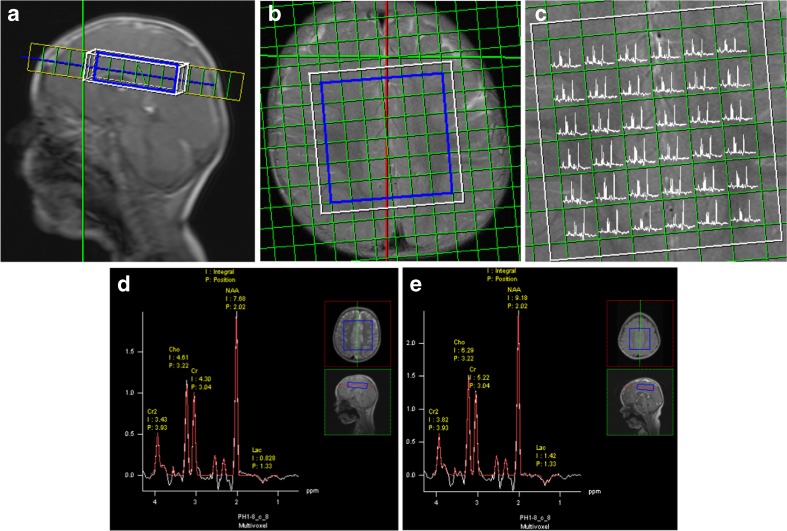
Fig. 1.
1HMR spectroscopy of a representative supraventricular region of interest (ROI), volume 7 × 7 × 2 cm2 (a, b). The resulting spectral map of the transverse plain, 36 voxels of 1 × 1 × 2 cm2 each (c). Representative summed spectrum for the entire ROI of a child from the unlikely group showing a modest lactate peak (the inverted doublet at 1.33 ppm) (d), and one of a child from the definite group showing increased lactate (e). p.p.m., parts per million

