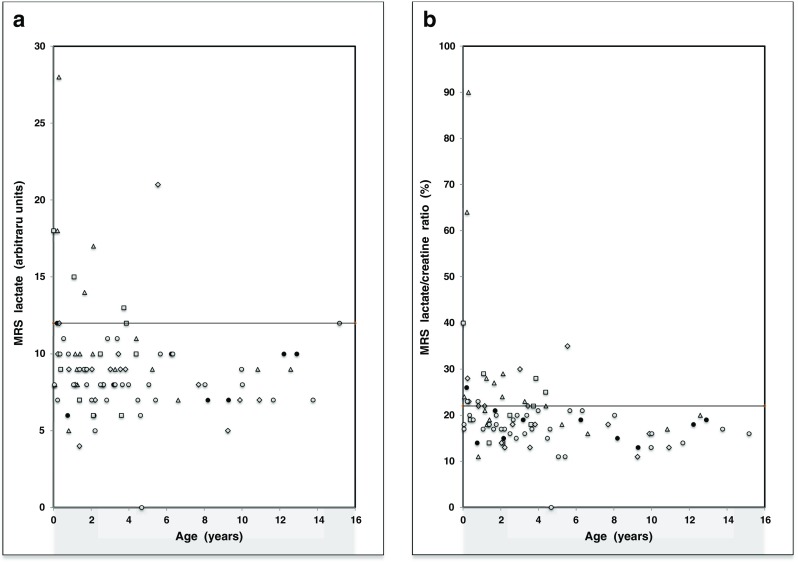
Fig. 2.

Scatter plot of the MRS lactate values (a) and percent L/Cr ratios (b) in the definite (Δ; n = 17), probable (□; n = 10), possible (◊; n = 17) and unlikely mitochondrial disease group (○,●; n = 44), and in a subgroup of 10 “unlikely” patients with a normal neurological exam (●)
