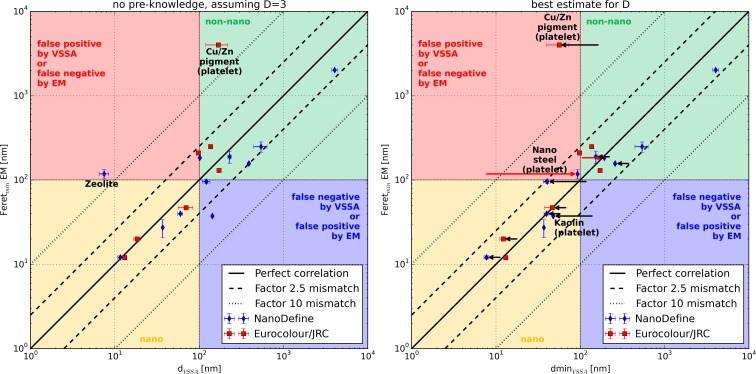
Fig. 3.
Correspondence between the VSSA-derived particle dimension d VSSA and dminVSSA and the Feretmin from EM. In the left panel, the available data from the NanoDefine and the JRC/Eurocolour materials are shown, assuming the case of no pre-knowledge on the particle shape (i.e., D = 3 for all materials and no porosity correction). In the right panel, the same materials are shown, but this time dminVSSA was calculated using the best estimate for the number of small dimensions D (the shift which occurred in comparison to the case with D = 3 is indicated with black arrows), and the effect of an additional t-plot evaluation (always ISO method except for TiO2 which is calculated according to Lecloux) is shown by red arrows. In both panels, a color code indicates the NM classification of the data points. In the yellow and green areas, the materials are consistently classified as nano and non-nano, repectively, by VSSA and EM. In the red and blue areas, both methods disagree on the classification. The error bars are the standard deviations resulting from size measurements (d 50 for EM and dminVSSA, respectively) of different labs. Note that these are no combined measurement uncertainty budgets, which is particularly important in the case of platelet materials; as for them, EM cannot assess the smallest particle dimension

