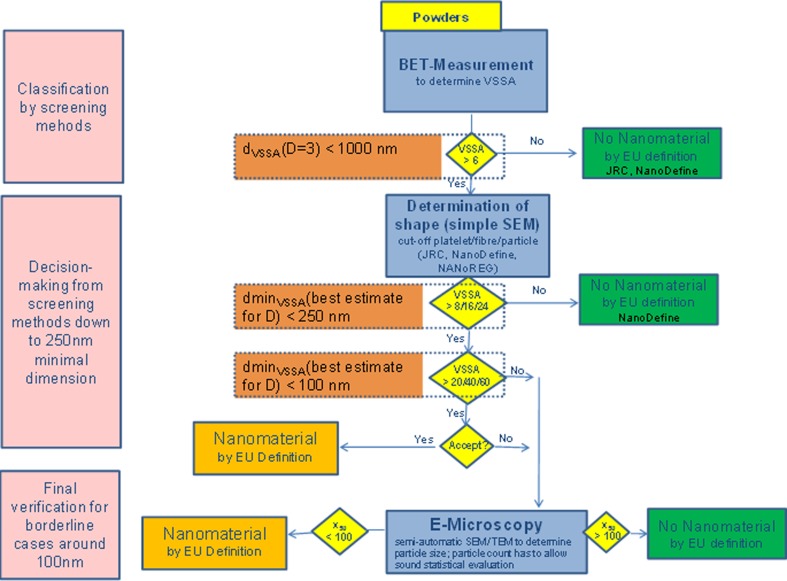
Fig. 4.
Flow chart of the proposed screening strategy, as proposed in the NanoDefine project (http://www.nanodefine.eu, deliverable D7.10) with the cutoff values adapted to the here developed screening strategy. The orange boxes were added to show the correspondence of the dminVSSA and the shape-dependent cutoff values

