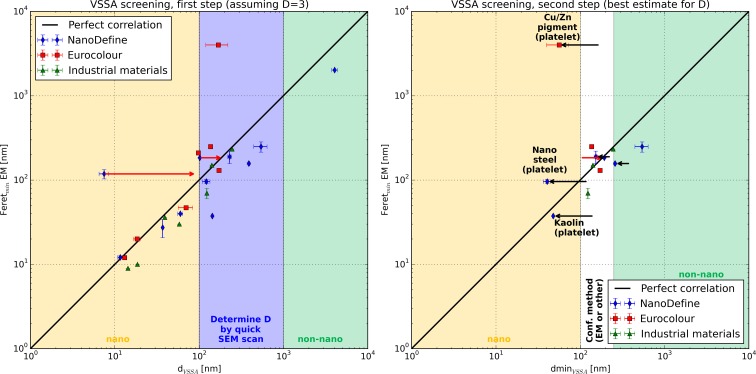
Fig. 5.
Test of the VSSA screening strategy. Plots similar to the ones in Fig. 2, but with colored background for the VSSA-derived NM classification, and adding the test set of further industrial materials. The left panel shows the first step where materials in the yellow (nano) and green (non-nano) areas are classified without detailed knowledge about the particle shape. Only for the materials in the blue area, a descriptive SEM evaluation determines the number of small dimensions. In the right panel, the remaining materials (from the blue area on the left) are classified with the best estimate for D, only the ones in the white area remain for a detailed evaluation with a confirmation method. As in Fig. 3, red arrows indicate the correction by the t-plot method and black arrows the correction after evaluating the materials with the best estimate for the number of small dimensions

