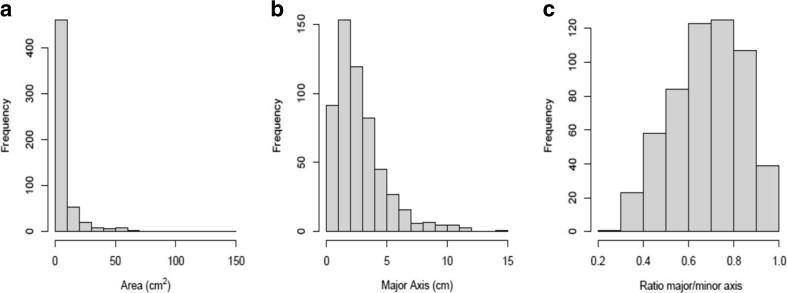
Fig. 4.
Histograms showing the distributions of area of lesions, major axis, and ratio of major axis/minor axis. The figure shows that the distributions of area of lesions, major axis, and ratio of major axis/minor axis—indicative of the shape of a lesion—are all multimodal (i.e. not normally distributed). The figure also shows descriptive statistics on macroscopic appearance of lesions. The distribution of area of lesions (a) ranges from 0.1 to 147.3 cm2 with a median of 3 cm2; the distribution of major axis (b) ranges from 0.4 to 14.1 cm with a median of 2.3 cm; the distribution of the ratio of major axis/minor axis (c) ranges from 0.3 to 1, with a median of 0.7

