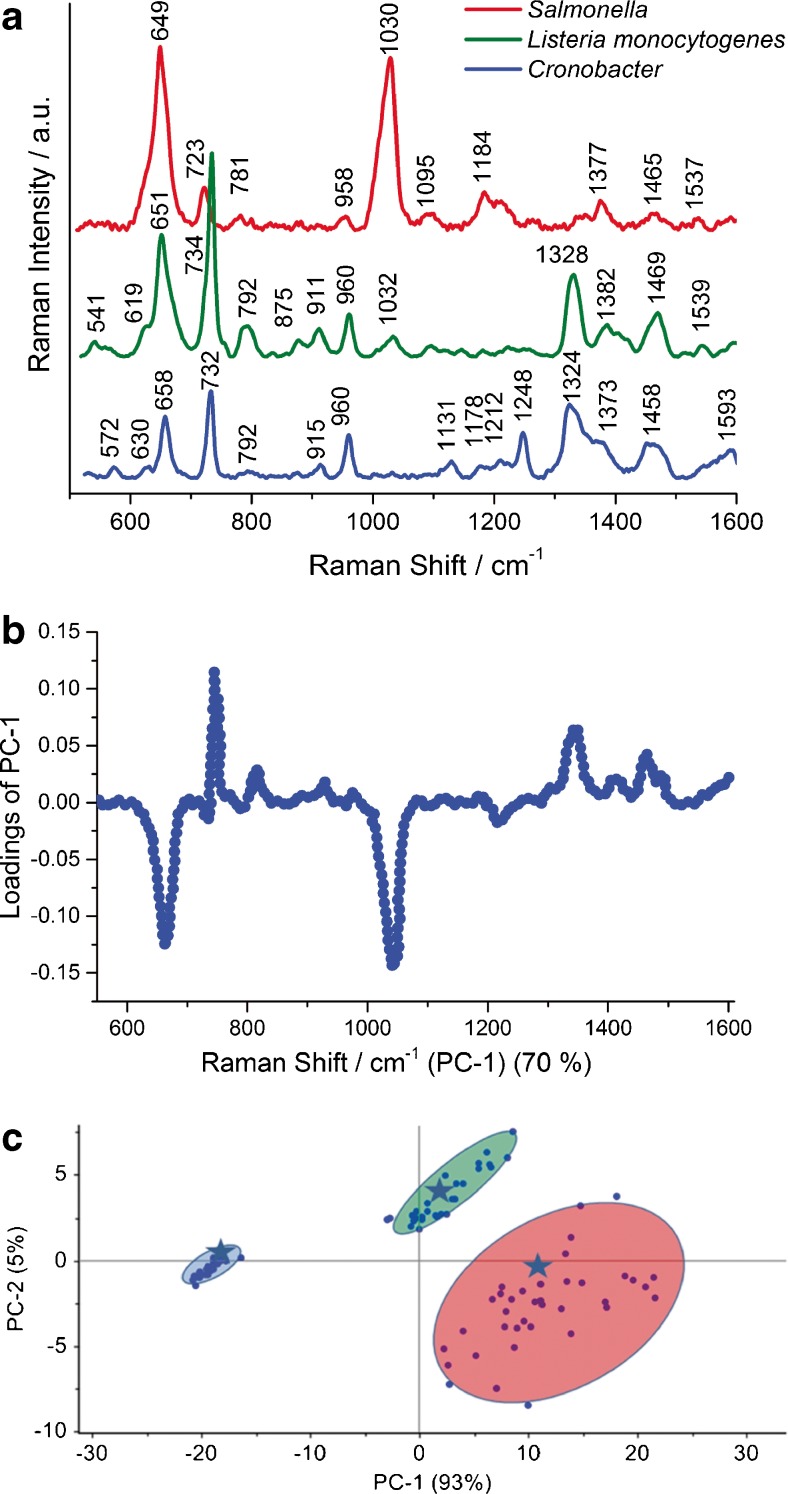
Fig. 5.
SERS spectra of Salmonella Typhimurium, L. monocytogenes, and C. sakazakii (a). Loadings plot of the first principal component showing the most prominent marker bands and b plot of the PC-1 versus PC-2 for the selected marker band at 650 cm−1 (c). Asterisks represent the scores calculated for test samples (smoked salmon—Salmonella spp., ham—L. monocytogenes, and powdered infant formula—Cronobacter spp.)

