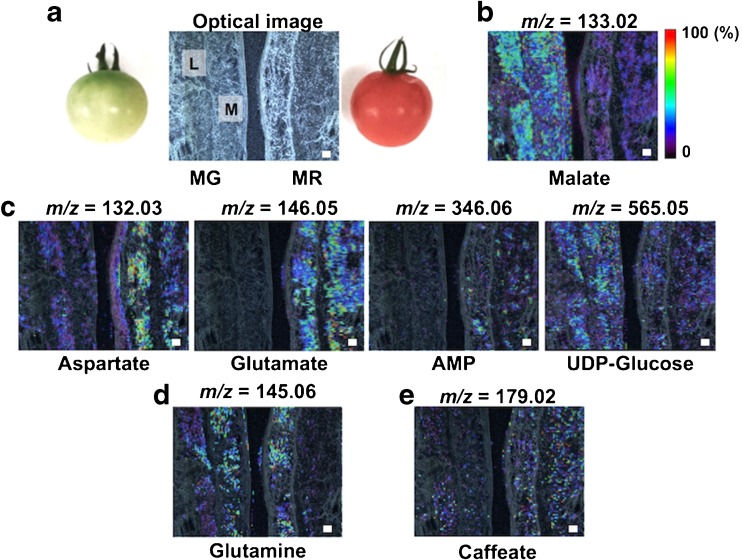
Fig. 3.
Analysis of the metabolic changes during the progression of ripening process using different ripening phenotypes with 9-AA-based MALDI–MSI. a Optical image of thin-sections of the mature green (MG) and MR tomato fruits. M mesocarp, L locule. Ion images of b sour compound, c umami compound, d primary metabolites, and e secondary metabolite. Scale bar = 1.0 mm

