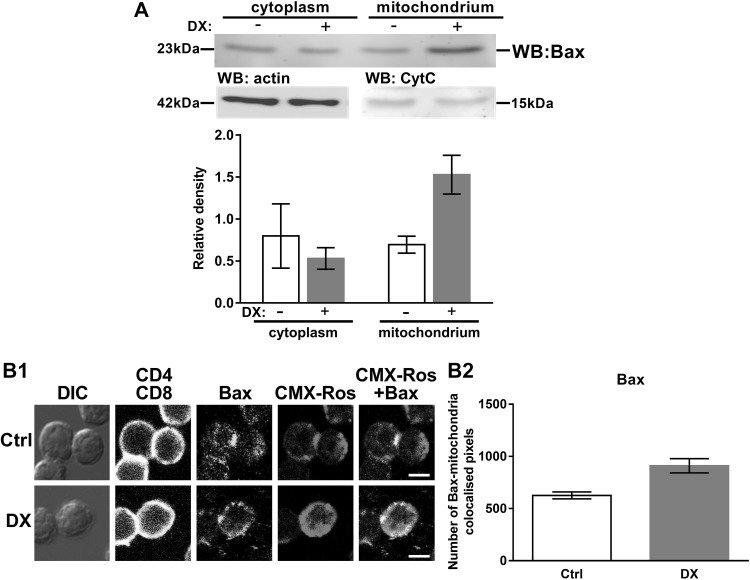
Fig. 3.
Subcellular distribution of Bax in thymocytes upon DX treatment. a Western blot shows the DX treatment-induced redistribution of Bax between the cytoplasmic and mitochondrial fractions of thymocytes. Blots were reprobed with anti-β-actin or anti-Cytochrome C (Cyt C) antibodies to confirm the purity of the cytoplasmic and mitochondrial fractions, respectively. The figure shows a representative blot and the densitometry data of at least three independent experiments. The diagram shows the relative Bax expression in the cytoplasm (normalized to β-actin) and the mitochondria (normalized to Cytochrome C). Bars represent the mean ± SEM of relative densities compared to the controls. b Mitochondrial translocation of Bax in DP thymocytes. b1 Representative confocal microscopic images of at least three independent experiment showing CMX-Ros-Bax co-localization in control (Ctrl) and 30 min DX-treated cells. DIC, CD4 (blue channel) and CD8 (virtual red channel) overlaid, mitochondria (CMX-Ros, red channel) and Bax (green channel) images are shown. The co-localization of mitochondria with Bax (CMX-Ros-Bax merged images) is indicated by yellow areas. Scale bars are 8 µm each. b2 Quantification of the changes in the CMX-Ros-Bax co-localization in DP thymocytes after in vitro DX treatment was performed using the co-localization plugin of the ImageJ software. Bars represent the number of co-localized pixels. The mean ± SEM was calculated from the data of 100 DP cells per treatment, respectively. (Color figure online)

