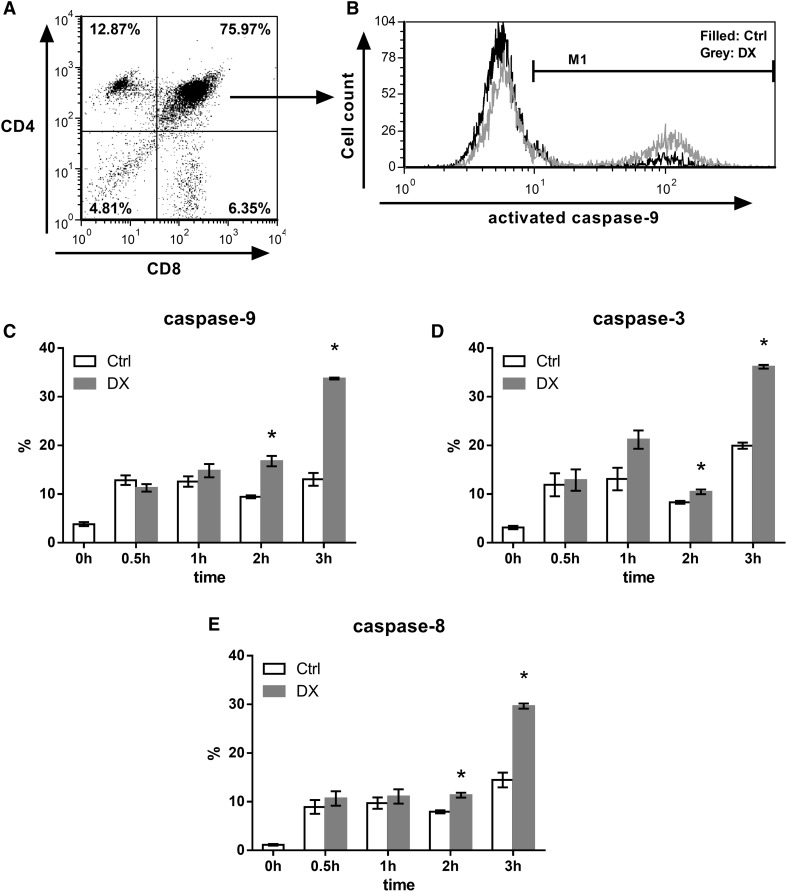
Fig. 4.
Flow cytometric analysis of the kinetics of caspase activation in DP thymocytes upon 30 min to 3 h of DX treatment. a Thymocyte subpopulations were gated based on their CD4/CD8 expression. b The representative fluorescent histogram plot shows the active caspase-9 positive percentage of DP thymocyte subpopulation before and after 3 h of DX treatment. Bar diagrams show the mean ± SEM of cleaved, active caspase-9 (c), -3 (d) and -8 (e) positive percentage of cells (calculated from the data of three animals) in the DP thymocyte population and its changes upon 30 min to 3 h of DX treatment. Significant (p < 0.05) differences compared to the untreated controls are indicated by asterisk

