Fig. 5.
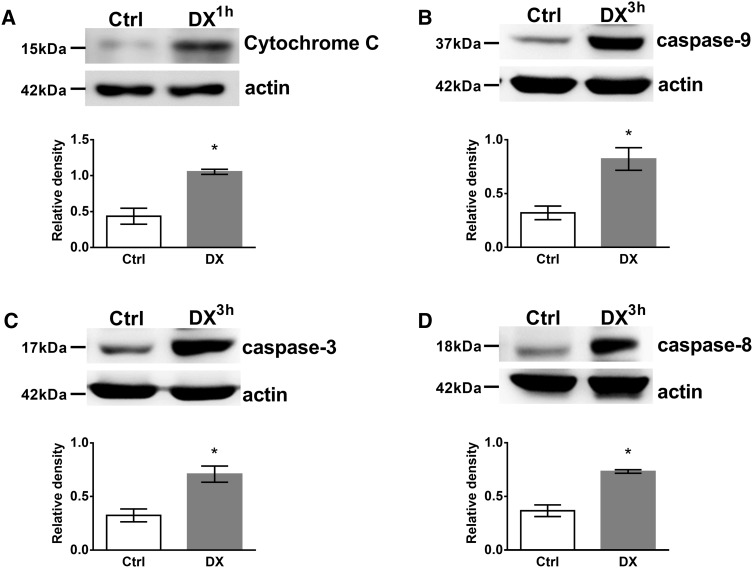
Western blot analysis of DX treatment induced Cytochrome C release to the cytoplasm and caspase-3, -8, -9 activation in thymocytes. The cytoplasmic presence of Cytochrome C (a), active (cleaved)-caspase-9 (b), -3 (c) and -8 (d) were detected in thymocyte lysates by western blot. Blots were reprobed with anti-β-actin antibody to confirm equal loading of the samples. The figure shows representative blots and the densitometry data of at least three independent experiments. Diagrams below each blot show the relative Cytochrome C and caspase-9, -3, -8 levels (normalized to β-actin). Bars represent the mean ± SEM of relative densities compared to the untreated controls. Significant (p < 0.05) differences are indicated by asterisk

