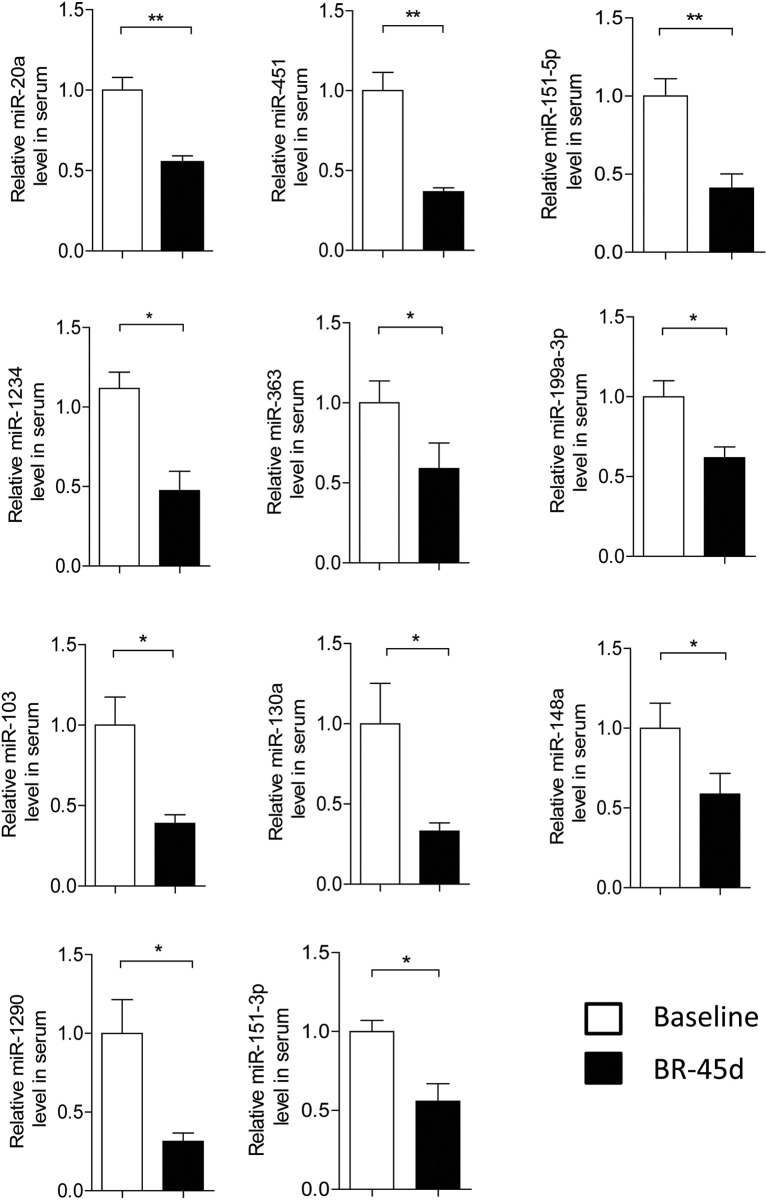
Figure 2.
Validation of microRNA (miRNA) microarray data by quantitative reverse-transcription polymerase chain reaction. The relative levels of miRNAs were normalized to levels of the control (cel-miR-39). Baseline, pre-bed rest; BR-45d, post-45 days of bed rest. n = 4, the P-values were calculated by 2-tailed Student t-test. *P < 0.05, **P < 0.01.

