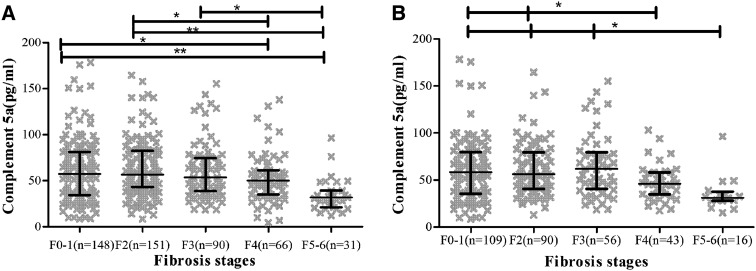
Fig. 1.
Association between complement 5a concentration and liver fibrosis. Dotplots for complement 5a according to fibrosis stage showing mean values and interquartile ranges (IQRs). a Complement 5a in total patients; b complement 5a in patients with ALT ≤ 2 × ULN. P < 0.001 for all fibrosis stags. ***p < 0.001, **p < 0.01, *p < 0.05

