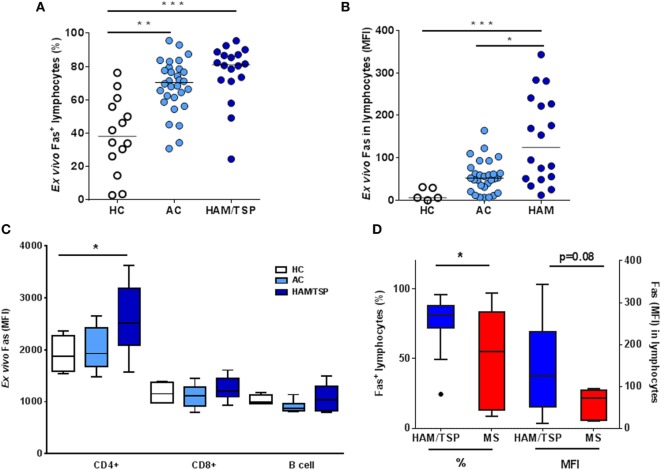
Figure 2.
Ex vivo lymphocyte Fas surface expression in HTLV-1-infected individuals (AC), HAM/TSP, and multiple sclerosis (MS) patients. Using flow cytometry, Fas levels as % (A) and mean fluorescence intensity (MFI, on a per cell basis) (B) were quantified in HC, AC, and HAM/TSP patients (*p < 0.05, **p < 0.01, ***p < 0.001; Kruskal–Wallis, with Dunn’s multiple comparison post-test). (C) Fas expression in CD4, CD8, and B cells was quantified in ex vivo PBMC in HC, AC, and HAM/TSP patients (ANOVA, p = 0.067, post-test for linear trend p < 0.05). (D) Ex vivo Fas levels (% and MFI) are compared between neuroinflammatory diseases HAM/TSP and MS (Mann–Whitney test, *p < 0.05).

