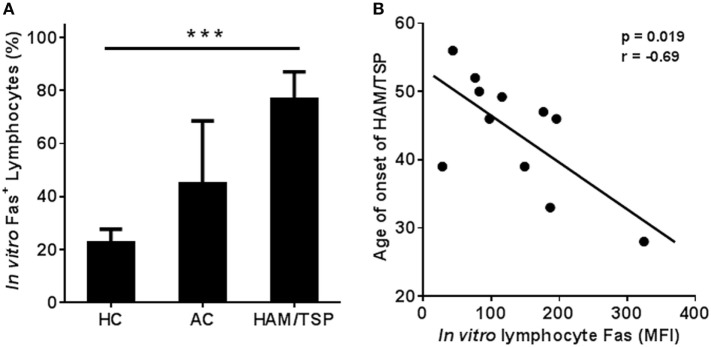
Figure 4.
Significant linear trend in Fas+ lymphocyte levels in PBMC of HC, AC, and HAM/TSP patients upon in vitro culture, and negative correlation with age of onset of HAM/TSP. (A) Fas levels were quantified by flow cytometry after 48 h of in vitro culture. Fas+ lymphocytes (%) gradually increase (HC: n = 12; AC: n = 4; HAM: n = 12) upon infection (AC) and further upon disease progression to HAM/TSP (ANOVA, p = 0.0005; posttest for linear trend, p < 0.0001). (B) Lymphocyte Fas levels (after 48 h of in vitro culture) quantified by flow cytometry (MFI) correlate negatively to age of onset in HAM/TSP patients (*p = 0.019, Pearson’s r = −0.69, n = 11).

