
Table 5.
Pearson correlations between the traits under salt stress (left lower triangle) and control (right upper triangle).
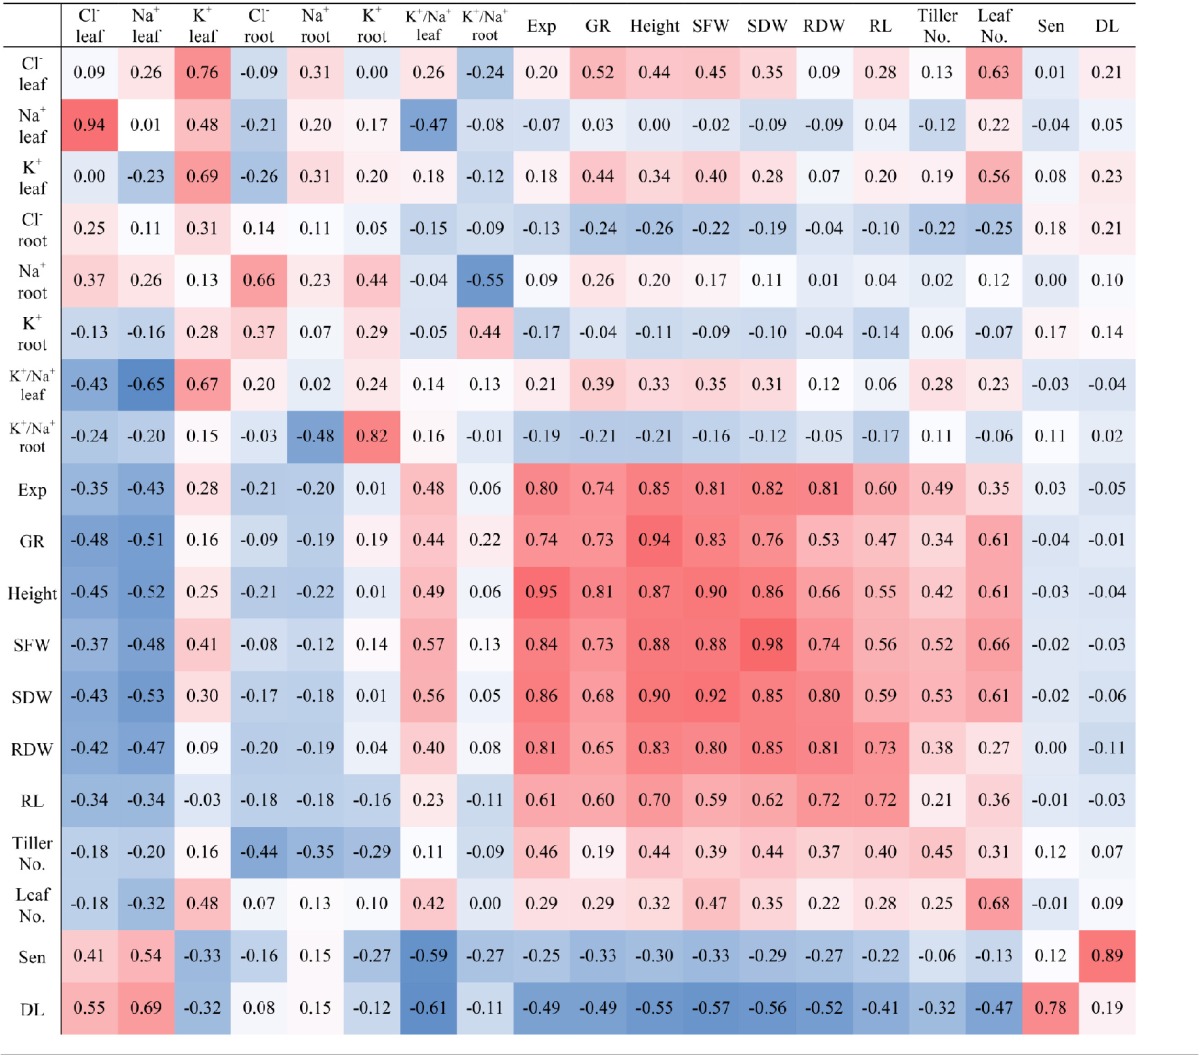
The left upper to right lower corner diagonal indicates the correlation between trait values for control and saline conditions.
Sen, Senescence; DL, Dead leaves; Exp, Expansion rate; GR, Growth rate; SFW, Shoot Fresh Weight; SDW, shoot dry weight; RDW, Root dry weight; RL, Root length.
From light red to dark red, increasingly more positive correlation. From light blue to dark blue, increasingly more negative correlation.