
FIGURE 6.
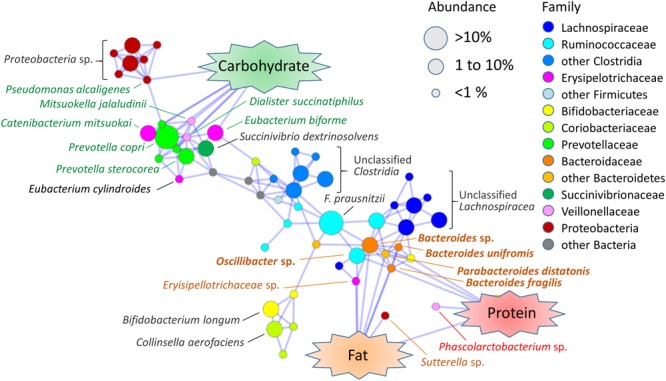
Association map among fecal bacterial species and dietary macronutrients in Leyte children. Pairwise Spearman’s correlation analysis was performed using the 40 Leyte children dataset of the relative abundances of 80 species (mean % > 0.1% for 40 children samples) and the energy ratio of the daily consumed three macronutrients. Correlation coefficients higher than 0.4 or lower than -0.4 with p < 0.05 were extracted and are visualized in association map using the Prefuse Force Directed Layout in Cytoscape 3.3.0. Only positive correlations are represented as blue-line edges. The colors of the species nodes represent taxonomy at family or higher level. The sizes of nodes represent mean population among the Leyte children. Species name associated with nodes indicates a closest species identified by SeqmatchQ400 analysis. Species names colored green, orange, or red represent species showing a significant association with the intake ratio of carbohydrate, fat, and protein, respectively. Species names colored orange and bolded represent species showing a significant association with intake ratio of both fat and protein.