
FIGURE 7.
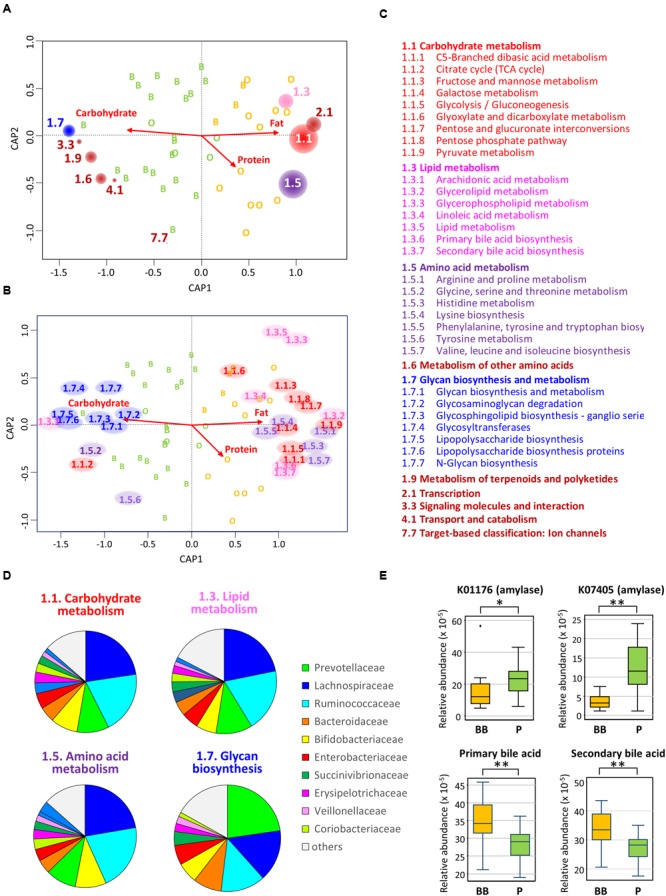
Correlation between gut bacterial community and genome-encoded functions. (A) Envfit plot of KEGG pathways at hierarchy level 2 on the CAP ordination computed in Figure 4. The abundances of KEGG pathways at hierarchy level 2 was estimated in each subject by the PICRUSt analysis based on the 16S rRNA composition data. Then, they were correlated with sample variance in the CAP by using envfit program; the KEGG pathways showing significant correlation in 999 permutations (p < 0.05) were displayed by red circles placed at the tips of undrawn vectors. The size of circle for each KEGG pathway is proportional to R2 in the envfit analysis. The code number of KEGG pathway is written beside the circle and is listed with the functional annotation in (C). (B) Envfit plot of KEGG pathway at hierarchy level 3 on the CAP ordination. The plot was simulated by the same methods used for level 2 in (A). The KEGG pathways showing significant correlation in 999 permutations (p < 0.05) were displayed by the pathway code no. placed at the tips of undrawn vectors. The code numbers are colored by the KEGG pathway hierarchy level 2 and are listed with the functional annotation in (C). (C) The code numbers and their functional annotations of KEGG pathways figured in (A) for hierarchy level 2 and (B) for hierarchy level 3. The letters are colored the same as for the codes in the other panels. (D) Contribution of each bacterial family to the KEGG pathways in the bacterial community of Leyte children. For each KEGG pathways, gene counts were estimated in each bacterial family based on the KEGG gene content table (ko_13_5). Then, counts from all families were summed and graphed as pie chart. (E) Abundances of two KEGG genes annotated as amylases (upper two graphs) and KEGG pathways, respectively, annotated as primary and secondary bile acids (lower two graphs). Relative abundances of these KEGG genes and KEGG pathways were calculated by the PICRUSt and were displayed as box plots showing the smallest and largest values, 25 and 75% quartiles, the median, and outliers. Statistical difference in the abundance was examined between BB-type and P-type groups by Wilcoxon rank-sum test for the two amylase genes and Student’s t-test for the pathways of primary and secondary bile acid biosynthesis. Single and double asterisks represent p < 0.05 and p < 0.001, respectively.