
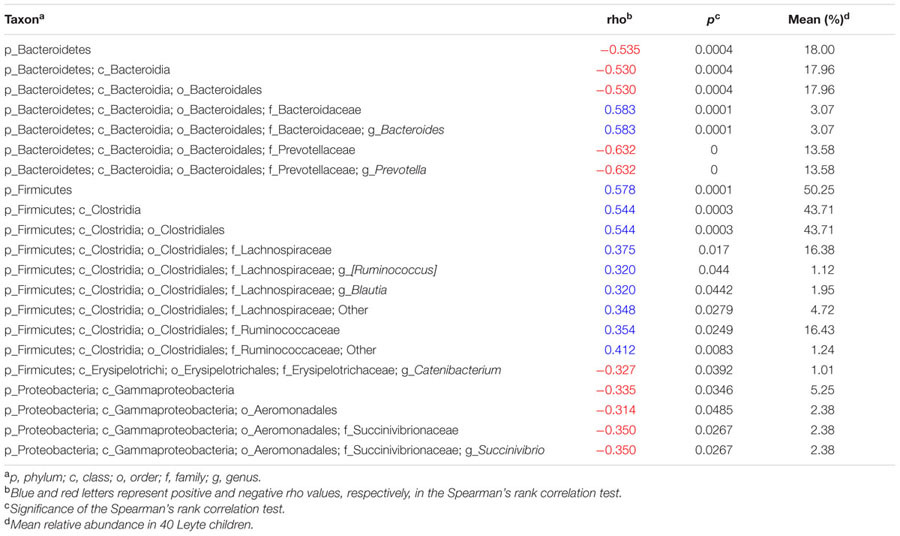
Table 2.
Spearman’s rank correlation coefficient between fat intake ratio and relative abundance of each taxonomic group.
 |
Official websites use .gov
A
.gov website belongs to an official
government organization in the United States.
Secure .gov websites use HTTPS
A lock (
) or https:// means you've safely
connected to the .gov website. Share sensitive
information only on official, secure websites.
Spearman’s rank correlation coefficient between fat intake ratio and relative abundance of each taxonomic group.
|