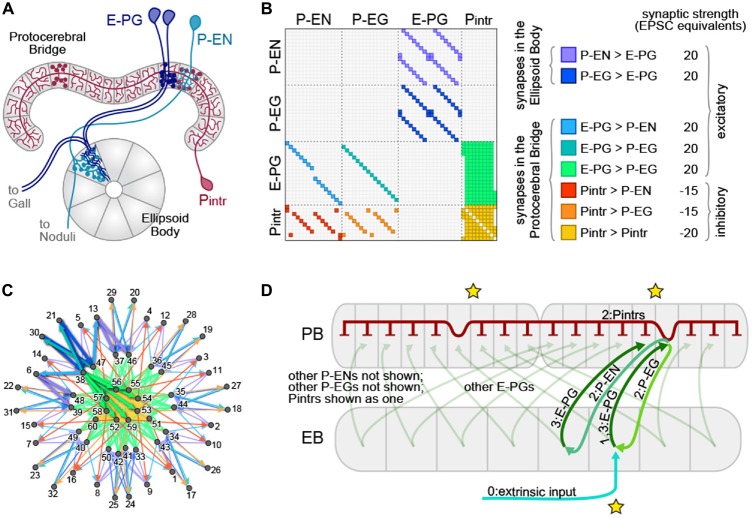
Figure 1.
The protocerebral bridge (PB) neural circuit. (A) Diagram of the PB and ellipsoid body (EB), illustrating three out of four modeled neural subtypes, the E-PGs, P-ENs and Pintrs. Not shown are the P-EGs which project from the PB to the EB. Axonal arbors are indicated with circular varicosities/boutons. Dendritic arbors are intricate with fine linear branches. Overlap of an axonal arbor and a dendritic arbor within a single anatomical compartment (gray regions) is sufficient to postulate a synapse between neurons. Neurons with identical morphologies at the level of these anatomical compartments (e.g., the two dark blue E-PGs) are represented in the model as a single neuron. (B) Matrix representation of the connectivity of the PB-EB circuit. A filled rectangle in row i, column j indicates a synapse, with neuron i presynaptic and neuron j postsynaptic. Different fill colors indicate different synapse classes, whose within-class strengths are shown at right. (C) Graph, with node positions determined by a force-directed algorithm of the network with connectivity shown in (B), which forms a ring with bilateral symmetry. Thick edges indicate lateral and reciprocal excitatory loops (local excitation) from neuron 38 (as an example) as well as excitatory connections to inhibitory neurons that target all glomeruli (long-range inhibition). (D) Schematic of key circuit motifs in the PB-EB network. Green and blue arrows represent excitatory neurons, red inhibitory neurons. All E-PGs are shown to illustrate the mapping of the EB to each PB hemisphere. Only one P-EG and one P-EN are shown. The pool of Pintrs are represented as a single neuron. Stars indicate the position where the bump will emerge in the EB and the PB hemispheres. Numbers on labels indicate the sequence in which neurons are activated.

