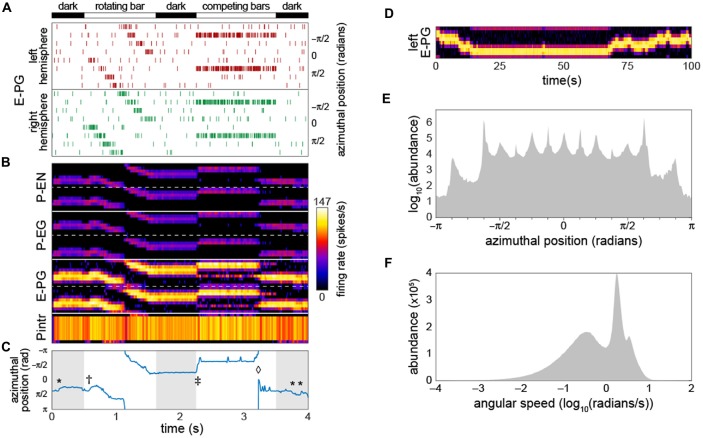
Figure 2.
Bump-producing circuit dynamics. (A) Input into the circuit is delivered as action potentials (raster marks) in neurons upstream of the E-PGs, plotted vs. time. Various sensory stimuli can be represented, including rotating bars, and static competitors. In “dark” periods, the only input is Poisson-distributed background activity. Inputs are associated with the eight tiles (Wolff et al., 2015) of the EB, and corresponding azimuthal angles in body coordinates are indicated. (B) Activity of all 60 neurons in the circuit vs. time. Plotted heatmap is a Gaussian-convolved raster of action potential times (standard deviation 24 ms). Dotted lines demarcate left from right hemispheres within a neural subtype. (C) Position of the bump (centroid of activity in B; blue line) vs. time. *Indicates “spontaneous” shifts in the position of the bump in darkness. †Indicates the bump sliding to the position of a bar as soon as it appears, and then following it as it rotates. ‡Indicates the bump jumping to the position of a single competitor when two static competitors appear. ⋄Indicates the bump spontaneously switching its position to that of the other competitor. (D) Bump behavior in darkness vs. time over a prolonged period in the left hemisphere E-PGs. (E) Histogram of bump frame-by-frame centroid position over 383 simulations of 4 s each in darkness. (F) Histogram of spontaneous bump angular speed in the same dark simulations.

