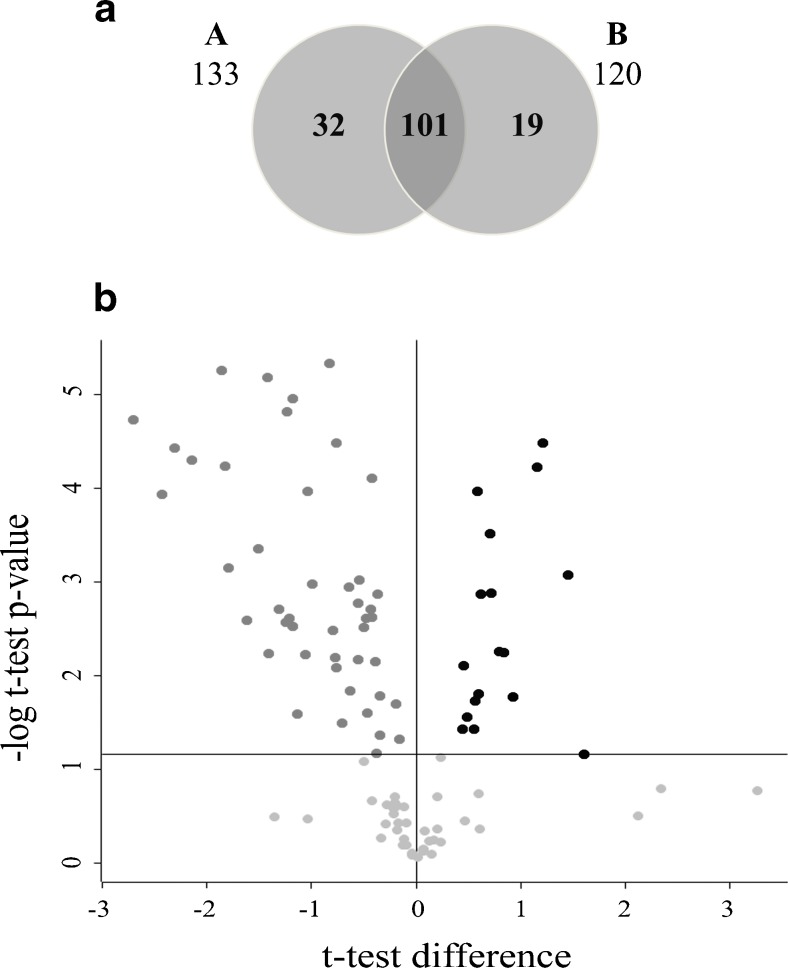
Fig. 1.
Proteomic profile of human blastocoel fluid isolated from women aged < (group A) and ≥ (group B) 37 years. a Venn diagram of the proteins identified in groups A and B. b Vulcano plot showing the proteins common to both groups differentially expressed in group B compared to group A. Common proteins were considered differentially expressed if they showed significant t test difference (cut-off at 5% permutation-based False Discovery Rate) between the two groups. Proteins up- and downregulated are indicated in black and dark gray, respectively. Proteins which are present at levels not statistically different between groups A and B are indicated in light gray below the horizontal threshold line

