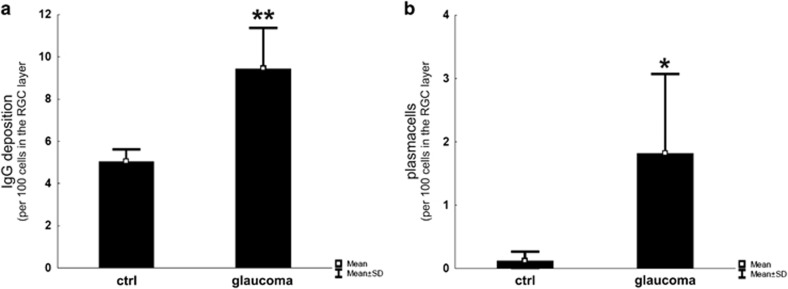
Figure 4.
Quantification of IgG depositions and plasma cells in cross-sections of human glaucomatous and healthy retina. (a) The number of IgG deposits in relation to the number of remaining cells is significantly increased. (b) Based on morphological features, plasma cells were only detectable in the glaucomatous group. *P=0.05; **P=0.01. (Adapted from Gramlich et al49)

