
Figure 2.
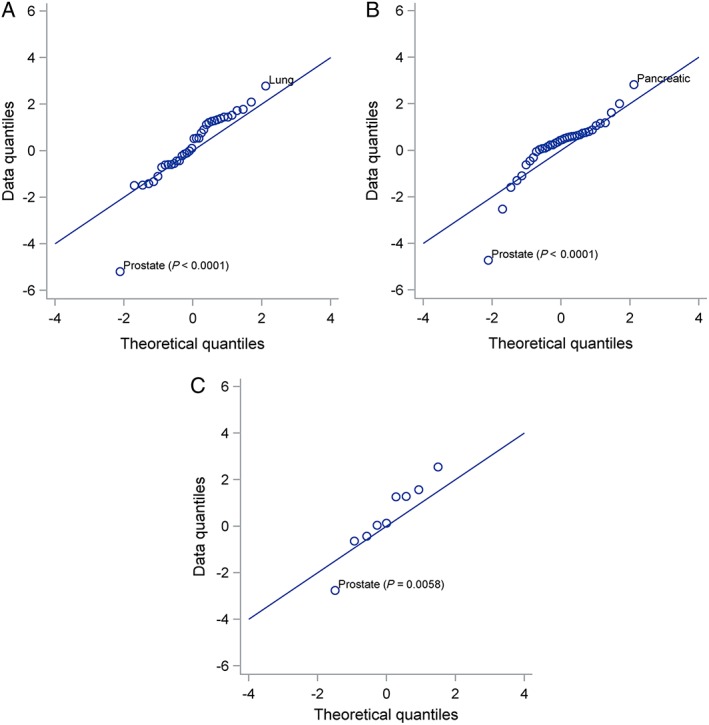
Q‐Q plots for hazard ratios associated with exposure to spironolactone. Three sensitivity analyses are shown: (A) Follow‐up to last data collection; (B) Follow‐up to last contact with patient recorded in the Clinical Practice Research Datalink; (C) Primary outcomes in practices with Hospital Episode Statistics data available. Cancers with hazard ratios that are significant at P < 0.01 are labelled. Prostate cancer is highly significant in all three sensitivity analyses, which use different randomly selected control cohorts. Under the null hypothesis of no effect of exposure to spironolactone, hazard ratios divided by their standard deviations (z scores) would have a standard normal distribution and quantiles of the observed distribution would be close to the theoretical quantiles of the standard normal distribution