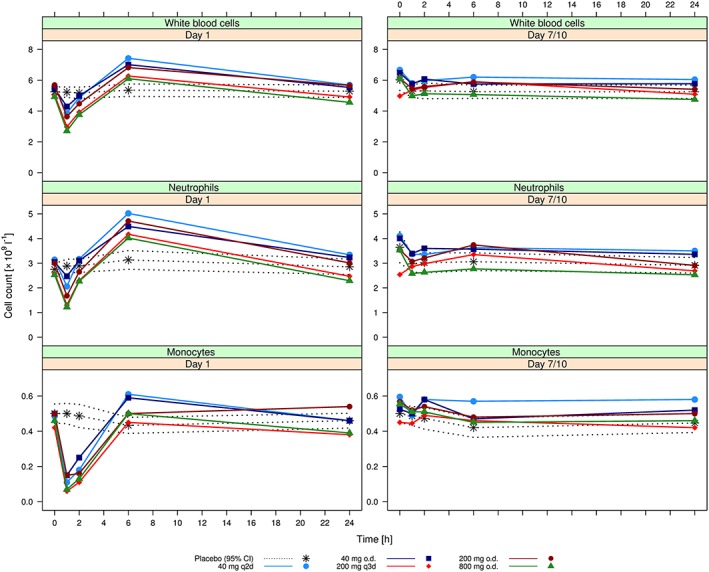
Figure 2.

Arithmetic mean [and 95% confidence interval (CI) for placebo] cell counts for white blood cells (top), neutrophils (middle) and monocytes (bottom) following administration of the first dose of ACT‐389949 on Day 1 (left) and at steady state on Day 7/10 (right) by dose group
