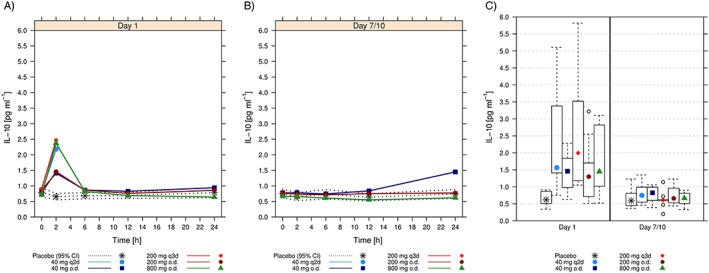
Figure 5.

Arithmetic mean [and 95% confidence interval (CI) for placebo] interleukin (IL) 10 plasma concentrations over time following administration of the first dose of ACT‐389949 on Day 1 (A) and at steady state on Day 7/10 (B) by dose group. (C) Comparison of plasma levels 2 h postdose on Day 1 and Day 7/10. Boxes indicate the range of the middle 50% of the data. Medians are shown as symbols in the boxes. Whiskers indicate the 95% range. Extreme values are shown individually. o.d; once daily; q2d, every other day; q3d, every 3 days
