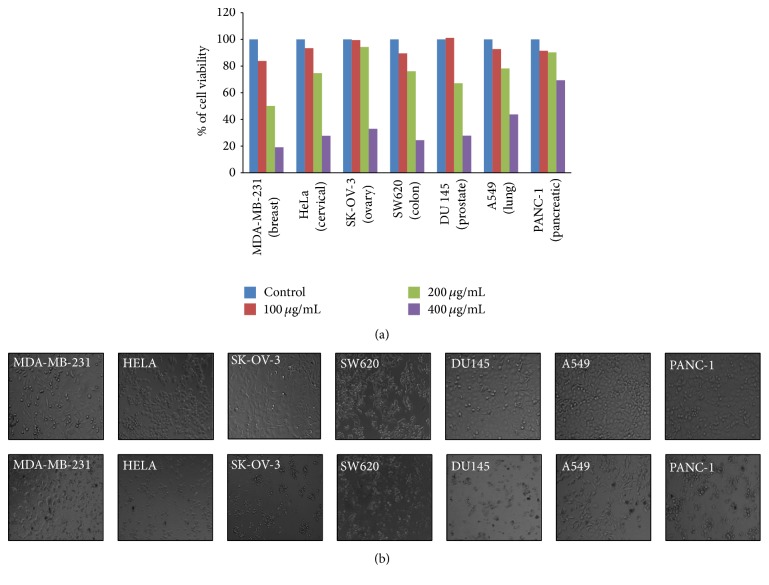
Figure 3.
AEEA induced growth inhibition in different cancer cell lines. MDA-MB-231 (breast), HeLa (cervical), SK-OV-3 (ovary), SW620 (colon), DU145 (prostate), A549 (lung), and PANC-1 (pancreatic) were treated with different concentrations of AEEA for 48 h and cytotoxicity was measured as described in Materials and Methods. Percentage cell viability was plotted in graphs (a). Brightfield microscopy. Effects of AEEA on the morphological changes in different cancer cells after 24 h treatment (400 μg/mL) were monitored by phase contrast microscopy (b).

