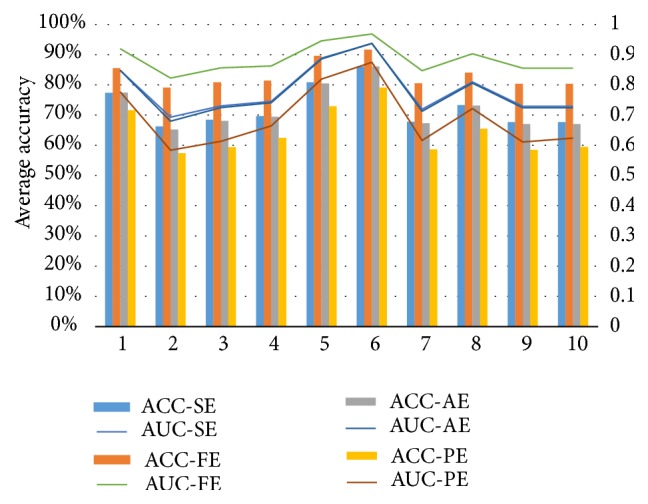
Figure 3.

Comparison of performances of four features and ten classifiers. The left s vertical coordinate is for average accuracy (%) for 12 subjects, while the right vertical coordinate is for average AUC for 12 subjects. The horizontal coordinate is for classifier. 1–10 represent KNN, LS, RS, GP, DT, RF, MLP, AB, GNB, and QDA, respectively. ACC-SE, ACC-FE, ACC-AE, and ACC-PE represent accuracy with features SE, FE, AE, and PE, respectively. AUC-SE, AUC-FE, AUC-AE, and AUC-PE represent AUC with features SE, FE, AE, and PE, respectively.
