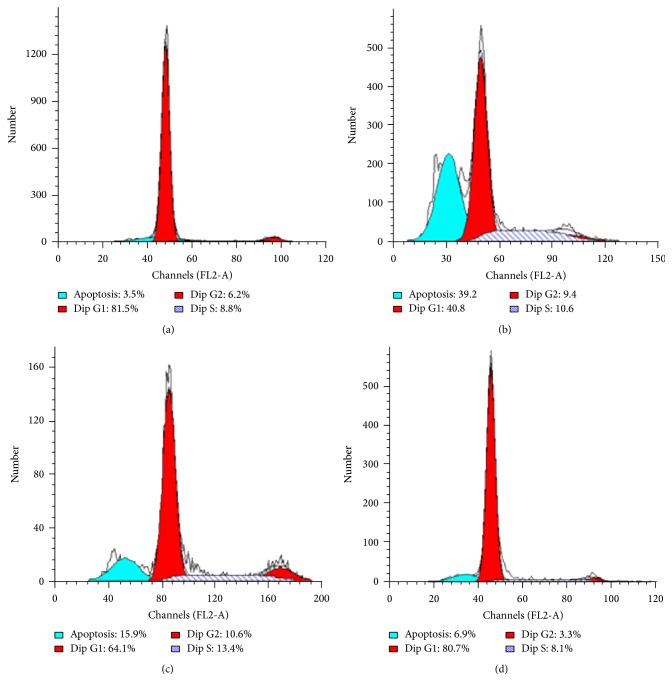
Figure 8.
Schematic histograms of DNA-cell cycle analysis using flow cytometry. (a) represents stomach mucosa cells from SHAM group. (b) represents stomach mucosal cells from ulcer control group. (c) represents stomach mucosal cells from ulcer control group + ranitidine (30 mg/kg) group. (d) represents stomach mucosal cells from ulcer control group + manuka honey (2.5 gm/kg) group.

