Figure 1.

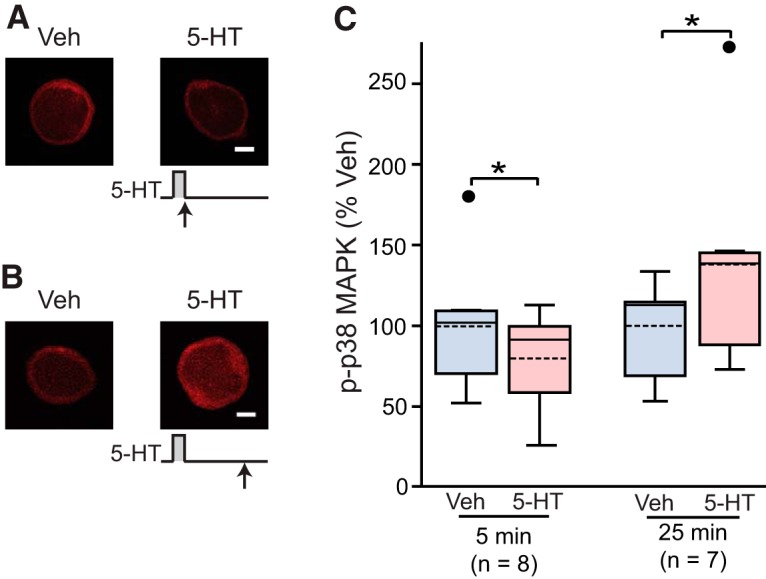
p-p38 MAPK at different times after one 5-min pulse of 5-HT (50 μM). A, Representative confocal images of p-p38 MAPK immunofluorescence in SNs immediately after the end of 5-HT. B, Representative confocal images of p-p38 MAPK immunofluorescence in SNs at 25 min after onset of 5-HT. C, Summary data. p-p38 MAPK levels were normalized to the mean of Veh controls. Treatment with 5-HT for 5 min significantly decreased p-p38 MAPK immediately after the end of treatment, whereas the same treatment led a significant increase in p-p38 MAPK when measured 25 min after onset of 5-HT. In this and other illustrations, data are presented by box-and-whisker plots. The median is indicated by the solid line in the interior of the box. The mean is indicated by the dashed line in the interior of the box. The lower end of the box is the first quartile (Q1). The upper end of the box is the third quartile (Q3). The ends of the vertical lines (whiskers) are the maximum and minimum values of nonoutliers. The small circles outside the whiskers are the outliers larger than Q3 + 1.5(Q3-Q1) or smaller than Q3-1.5(Q3-Q1). Scale bar, 20 μm. Significant differences are indicated by * for p < 0.05.
