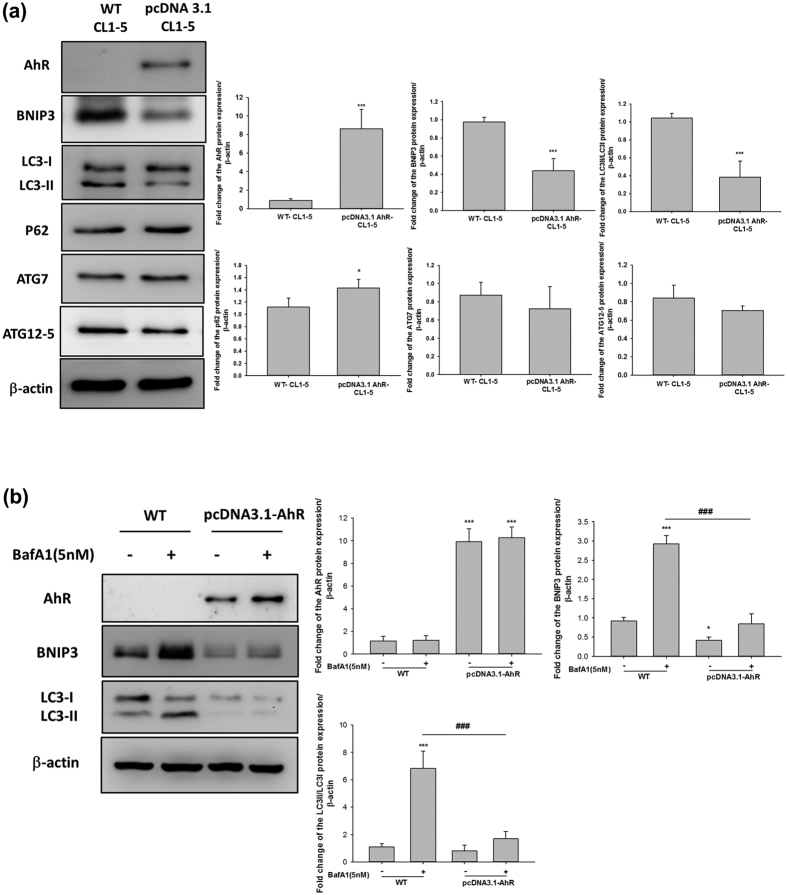
Figure 4. AhR-overexpression decreased autophagy in CL1-5 cells.
CL1-5 cells were transfected with pcDNA3.1-AhR for 24 h and autophagy-related proteins were then analysed by western blotting. (a) Western blotting showed that AhR overexpression decreased the levels of BNIP3 and LC3II/LC3I ratio. (b) BafA1 (5 nM) treatment of wild-type and AhR-overexpressing cells to compare autophagy flux. Quantification of the western blot data showing the fold-changes in BNIP3, p62, ATG12-5, LC3, and ATG7 expression. Full-length blots are presented in Supplementary Fig. S16. The data were analysed and expressed as the mean ± SD from three independent experiments. *P < 0.05; **P < 0.01; ***P < 0.001 compared with the control group. ###P < 0.001 indicate a statistical difference between wild-type and AhR overexpression cells in BafA1 treatment groups.

