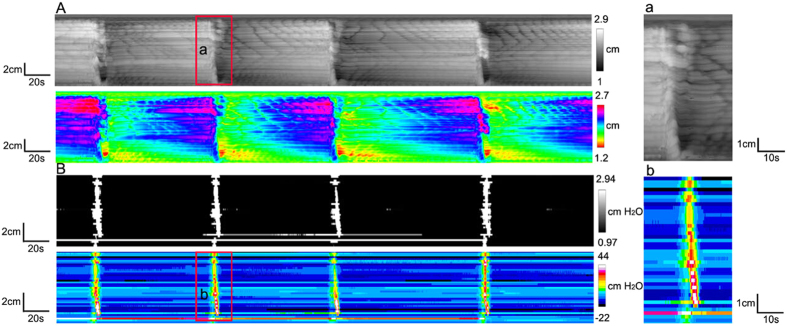
Figure 2. Propagation of LDCs.
(A) Spatiotemporal diameter map of LDCs showing propagation at a speed of 2.1 ± 0.3 cm/s from proximal to distal. The red boxed area (a) shows an obvious peristaltic wave, enlarged at right. (B) Clear propagations were shown in pressure maps of LDCs. A zoomed in portion (b) on the right side of the pressure map shows an obvious antegrade propagation with an average velocity of 1.8 ± 0.4 cm/s.

