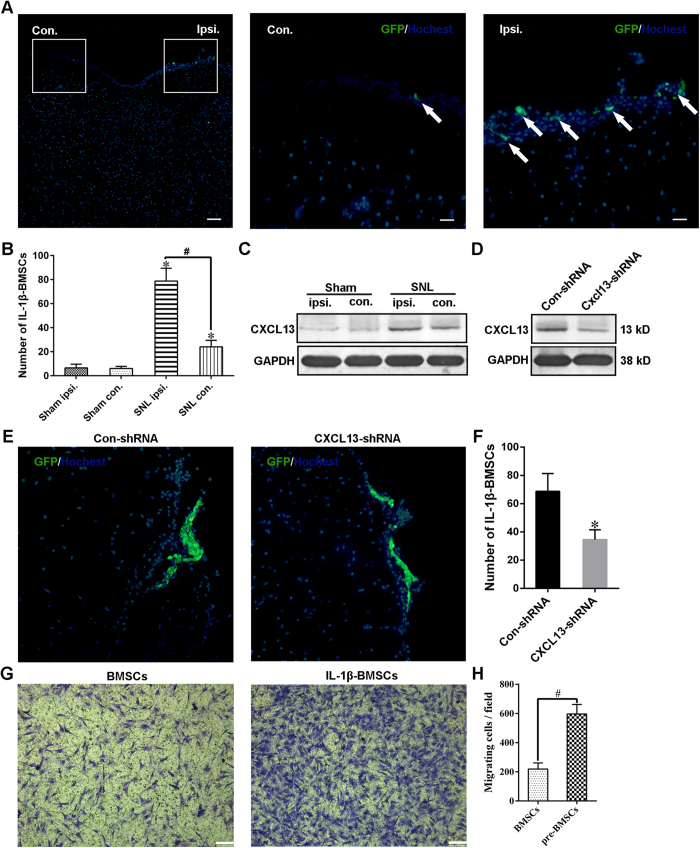
Figure 8. CXCL13 mediated the directional migration of IL-1β-BMSCs in vivo and in vitro.
(A) Representative immunofluorescent images of the spinal cord on day 7 after SNL (day 7 after IL-1β-BMSCs injection). The middle panel and the right panel were the enlarged images of the white box parts in the left panel. Arrows in the middle and right panels are GFP-labeled IL-1β-BMSCs (GFP-BMSCs). Scale bars = 200 μm (left panel) and 50 μm (middle and right panels). (B) Numbers of GFP-BMSCs in ipsilateral and contralateral spinal cords on day 7 after SNL or sham operation. (C) Expression of CXCL13 in ipsilateral and contralateral spinal cords seven days after SNL or sham treatment. (D) Expression of CXCL13 in ipsilateral spinal cords on day 7 after SNL. Control or Cxcl13 shRNA lentivirus vectors were injected three days before SNL. Full-length bolts in C and D were presented in Supplementary Figure S1. (E) Representative immunofluorescent images of GFP-BMSCs on the surface of an ipsilateral spinal cord. (F) Statistical results of the numbers GFP-BMSCs on the surface of ipsilateral spinal cords. (G) Representative images of transwell chemotaxis of BMSCs and IL-1β-BMSCs toward CXCL13. Scale bars = 100 μm. (H) Statistical results of cell migration. For (A–F), 32 rats in total and n = 7–8 rats/group (4 rats for immunofluorescence and 3–4 rats for western blot), and for (H) ten random fields at 100 × magnification were analyzed, n = 5 cultures/group. *P < 0.05 compared with the sham group or con-shRNA group, #P < 0.05. Statistical significance was determined using one-way ANOVA followed by Bonferroni’s post-hoc test for (B) or a Student’s t test for (F and H). All data were expressed as the mean ± SEM.

