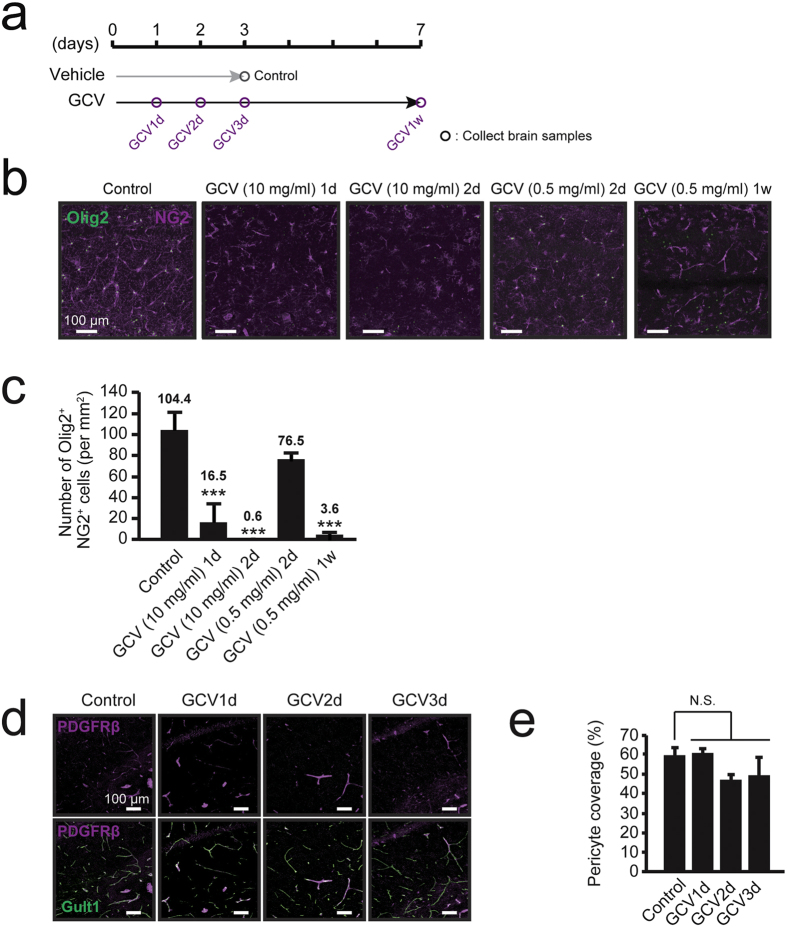
Figure 2. Ablation of NG2 glial cells in the hippocampus of NG2-HSVtk transgenic rats.
(a) Timeline of the experimental design for the treatment with vehicle and ganciclovir (GCV). (b) Confocal images of immunoreactivity for Olig2 (Olig2, green) and NG2 (NG2, magenta) in NG2-HSVtk transgenic rats treated with vehicle (Control) or GCV at doses of 10 and 0.5 mg/ml for 1, 2 or 7 days [GCV (10 mg/ml) 1d, GCV (10 mg/ml) 2d, GCV (0.5 mg/ml) 2d, GCV (0.5 mg/ml) 1w]. (c) The number of NG2 glial cells (immunopositive cells for Olig2 and NG2) in animals treated with vehicle or GCV. Mean ± SD, n = 3 rats [Control, GCV (0.5 mg/ml) 2d, GCV (0.5 mg/ml) 1w] or 5 rats [GCV (10 mg/ml) 1d, GCV (10 mg/ml) 2d]; ***p < 0.001, based on a one-way analysis of variance (ANOVA) followed by Tukey-Kramer test. (d) Confocal images of immunoreactivity for PDGFRβ (a marker of pericytes; magenta) and Glut1 (a marker of endothelial cells; green) in animals treated with vehicle or GCV for 1, 2, or 3 days. (e) Percentages of pericyte coverage in animals treated with vehicle or GCV. The pericyte coverage was determined as a ratio (%) of PDGFRβ-positive area on the Glut1-positive capillary to the total Glut1-positive area. Mean ± SD, n = 3 rats (Control, GCV1d, GCV2d, and GCV3d); N.S., non-significant, p > 0.05, based on a one-way ANOVA followed by Tukey-Kramer test (c,e). Scale bars represent 100 μm (b,d).

