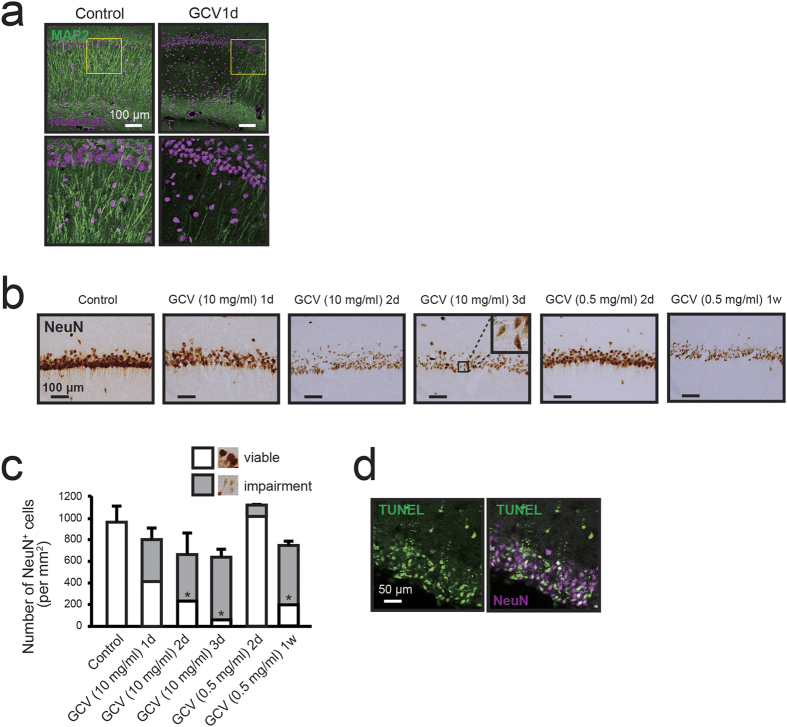
Figure 3. Ablation of NG2 glial cells induces neurodegeneration in the hippocampus.
(a) Confocal images of immunoreactivity for microtubule-associated protein 2 (MAP2, green) in NG2-HSVtk transgenic rats treated with vehicle (Control) or GCV at a dose of 10 mg/ml for 1 day (GCV1d). Lower panels show magnified views of those images presented in yellow boxes in the upper panels. Hoechst, cell nuclear staining. (b) Bright-field immunohistochemical observations of NeuN in the hippocampal CA1 region of NG2-HSVtk transgenic rats treated with vehicle or GCV at doses of 10 and 0.5 mg/ml for 1, 2, 3 or 7 days [GCV (10 mg/ml) 1d, GCV (10 mg/ml) 2d, GCV (10 mg/ml) 3d, GCV (0.5 mg/ml) 2d, GCV (0.5 mg/ml) 1w]. Black boxes in GCV (10 mg/ml) 3d show magnification of the microscopic view. (c) The number of NeuN positive cells in the hippocampus of NG2-HSVtk transgenic rats treated with vehicle or GCV at doses of 10 and 0.5 mg/ml for 1, 2, 3 or 7 days. Photomicrographs indicate representative images for viable (viable, white) and damaged neurons (impairment, grey). (d) Confocal images showing TUNEL (green) and immunoreactivity for NeuN (magenta) in the hippocampal CA2 region of NG2-HSVtk transgenic rats treated with GCV at a dose of 10 mg/ml for 3 days. Mean ± SD, n = 3 rats [Control, GCV (10 mg/ml) 3d, GCV (0.5 mg/ml) 2d, GCV (0.5 mg/ml) 1w] or 5 rats [GCV (10 mg/ml) 1d, GCV (10 mg/ml) 2d]; *p < 0.05, based on a one-way ANOVA followed by Tukey-Kramer test. Scale bars represent 100 μm (a,b) and 50 μm (d).

