Figure 5.
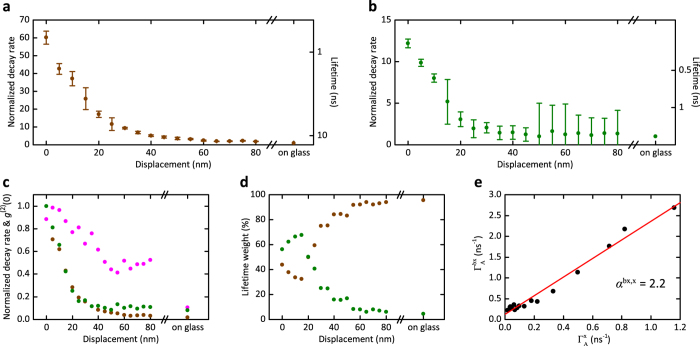
Lateral distance dependence of the monoexciton (a) and biexciton (b) fluorescence decay rates and lifetimes of a qdot. Distance zero denotes the cone apex. The error bars resulted from a standard deviation analysis of ten different measurements performed at each point as well as the uncertainty in fitting the decay curves. (c) The autocorrelation function g(2)(0) measured at each lateral displacement (pink). The same data as in (a) and (b) are also plotted normalized to their maximum values. (d) The distance dependence of the weighting ratios of the long and short lifetime components attributed to the monoexciton and biexciton emission channels. The measured values far from the nanocone and close to a glass substrate are also shown in each case. (e) The measured values of  and
and  , leading to the slope α.

