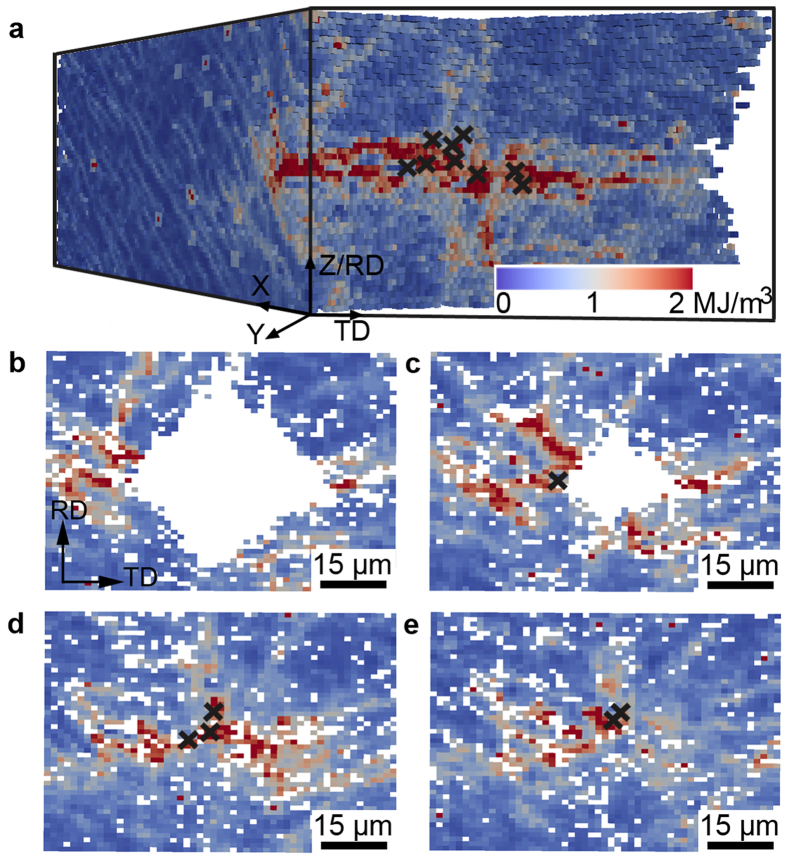
Figure 4. Distribution of stored energy in the deformed state.
(a) is a 3D map of the stored energy (magnitude indicated by the color legend). The crosses mark the positions of the identical embryonic volumes. (b,c,d and e) show sections near the indentation tip: (b) 8.5 μm above, (c) 4.3 μm above, (d) at exactly at, and (e) 3.2 μm below the tip.

