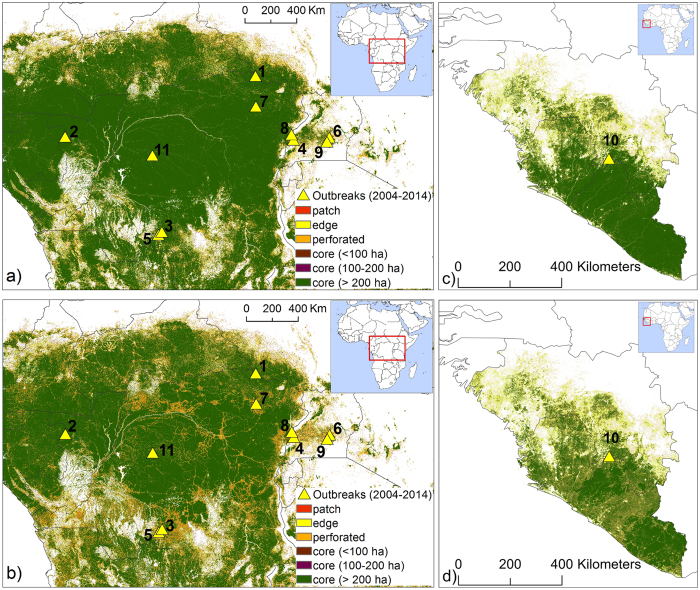
Figure 2. Forest fragmentation in Central and West Africa.
Forest fragmentation in Central (panels a, and b) and West Africa (Panels c and d) in 2000 (top panels) and 2014 (bottom panels). Fragmentation is measured by the number of patch, edge, perforated and smaller forest areas (<200 ha). Most of the centers of first infection (yellow triangular markers) are located in areas affected by increasing forest fragmentation (see Table S3, S4). Maps generated by the authors using ARCGIS 10.2-Version 10.2.0.338, licensed to Politecnico di Milano. The license term can be found on the following link: http://www.esri.com/legal/software-license.

