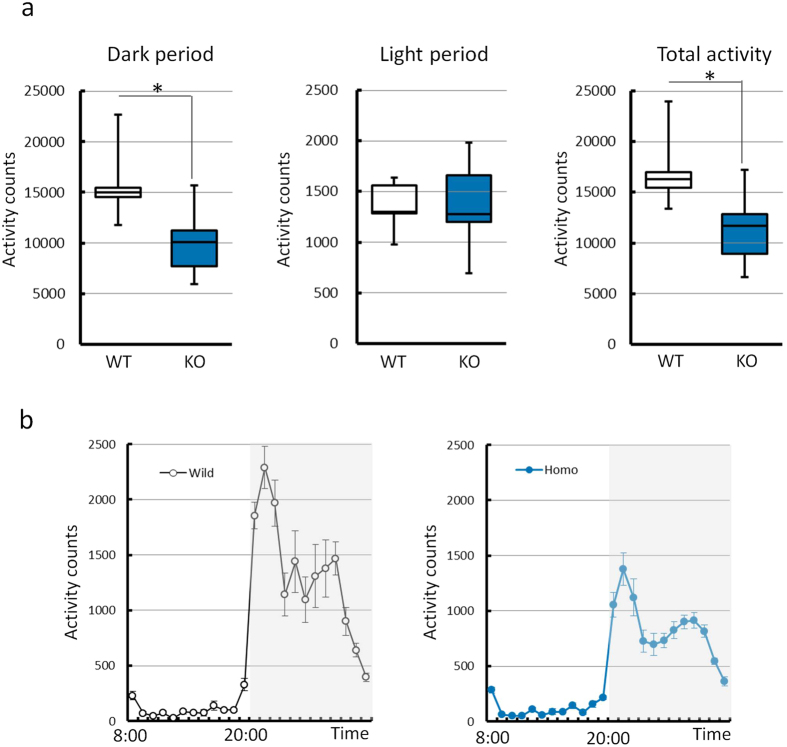
Figure 2. Comparison of the amount of activity in the home cage activity test.
(a) The amount of activity observed with wild-type (WT) and knockout (KO) mice in the dark period (left), light period (middle), and in the total period (right). The activity counts in the dark and total periods were lower in the KO mice than WT mice. *P < 0.05 (WT vs. KO mice, t test) (b) Mean amount of activity per hour over 5 days. White and grey boxes show the light and dark periods, respectively. The data were obtained from mice from line D (5 WT mice and 13 KO mice) and are presented as the mean ± S.E.M.

