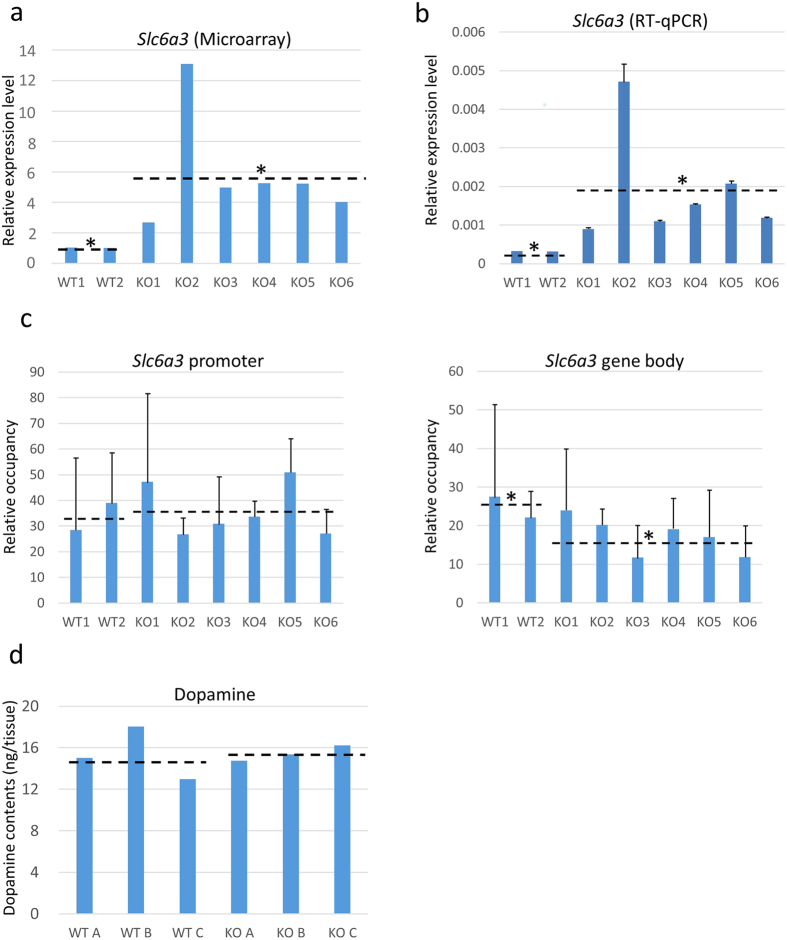
Figure 4. Levels of gene expression and H3K27me3 enrichment in the Slc6a3 gene, and dopamine concentrations in the midbrain.
(a) The expression levels of Slc6a3 measured by microarray. The average of wild-type (WT) samples was set as 1. *P < 0.05 (WT vs. knockout (KO) mice, t test). (b) The expression levels of Slc6a3 measured by RT-qPCR analysis. The mean level of WT was set as 1. *P < 0.05 (WT vs. KO mice, t test). Data are presented as the mean ± S.D. (c) ChIP analysis of enrichment of H3K27me3. There was a significant difference in the body of Slc6a3, but not in the promoter region. *P < 0.05 (WT vs. KO mice, t test). See Materials and Methods for the calculation method of the relative occupancy. Data are presented as the mean ± S.D. (d) Dopamine concentrations in the midbrain. There were no genotype-related differences. All data were obtained from mice of line A. The dashed lines represent the average values of each group.

