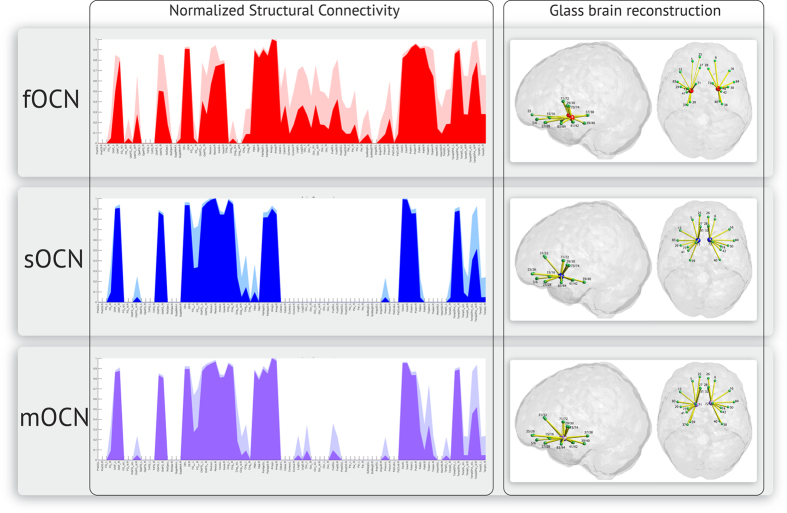
Figure 1. Structural connectivity fingerprint of the fOCN, sOCN and mOCN respectively.
The normalized structural connectivity plots display the mean connectivity and standard deviation (lighter colour), across all subjects, from the OCN seed of each template to all remaining areas in the AAL brain parcellation. The normalized connectivity measures are used to create a glass brain reconstruction of the structural olfactory connectivity network. The thickness of the edges (in yellow) indicates the average connection strength across all subjects. The green spheres represent the centre of gravity of each area involved in the secondary olfactory processing (for AAL area numbers, see Table 3).

