
Figure 8. Comparison of (PG/GLY) decomposition at power settings of 15 W using clearomizers of differing configurations from various sources.
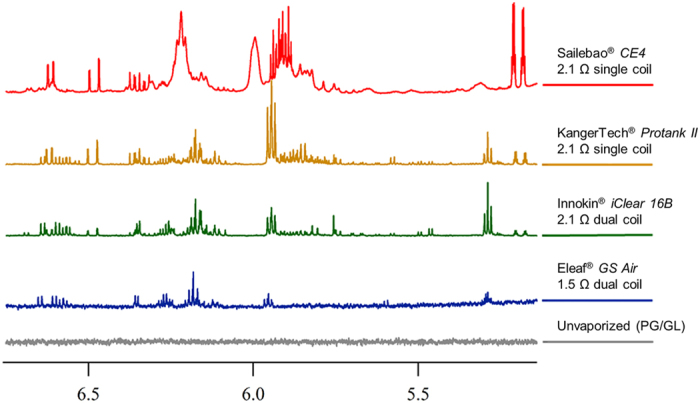
An expanded region of the 1H NMR spectra of aerosolized samples of PG/GLY in addition to an unaerosolized sample (bottom). The red spectrum (top) shows aerosol products generated via an inexpensive Sailebao® CE4 cartomizer and shows the highest abundance and diversity of degradation products. Now considered an outdated design, the CE4 clearomizers were purchased as a component of a “Starter Kit” in 2014, and are still widely available. Samples collected from more sophisticated devices typically produce spectra containing fewer peaks of lower intensity, as demonstrated by the spectra from samples vaped using the KangerTech® Protank-II and the Innokin® iClear 16B, plotted in orange and green, respectively. Expensive, more current devices such as the Eleaf® GS Air produce aerosolized samples showing relatively diminished product peak intensities as well as fewer degradation product peaks. While the extent of (PG/GLY) degradation varies between models, it is not unique to any one design.