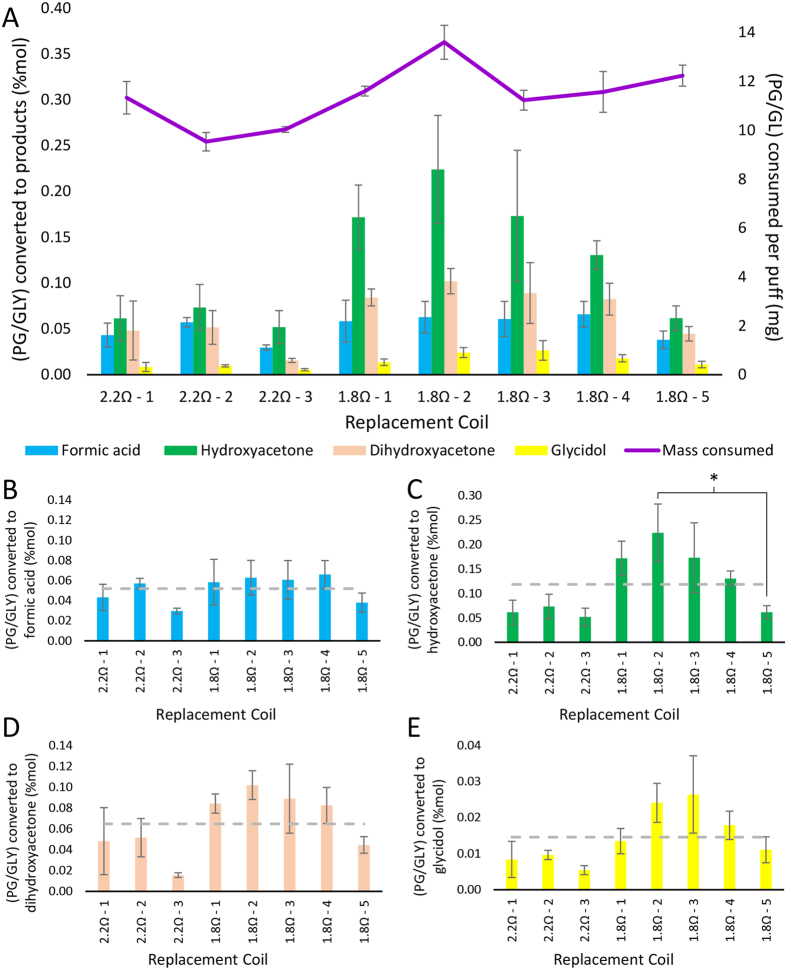
Figure 9. Individual heating elements of the same design and manufacture, identical in appearance and packaged together as replacement units, can demonstrate wide variation in the abundance and profile of decomposition products observed in samples collected under controlled conditions.
Depicted above are results from aerosolized samples of PG/GLY collected under fixed conditions from the KangerTech® Protank-II clearomizer, varying only the replaceable single-coil heating element. Three single-puff samples were collected at a modest power setting of 10 W from eight different replacement coils, three of which were labeled 2.2 Ω resistance by the manufacturer, while the other five were labeled 1.8 Ω resistance. (A) The intensity of NMR signals from several degradation products were compared by relative integration to the intensity of un-degraded PG/GLY peaks; the relative intensity of the thermal degradation products formic acid (Plot B, compound 14), hydroxyacetone (Plot C, compound 12), dihydroxyacetone (Plot D, compound 4), and glycidol (Plot E, compound 2) are plotted as percentages of the intensity of residual (PG/GLY). The average value among the eight replacement coils is plotted as a grey dashed line in plots B–E. All error bars denote a 90% confidence interval (n = 3). The asterisk (*) in plot C denotes p < 0.05 as determined by a two-variable, unpaired t-test.

