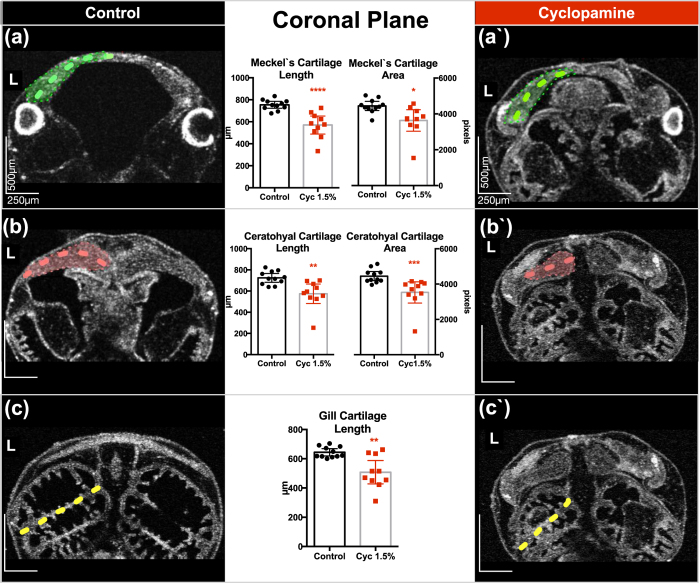
Figure 5. Quantitative neural crest defects in Xenopus with cyclopamine treatment.
(a/a′–c/c′) Stage 46 control tadpole compared to cyclopamine (2.5 mg) treated tadpoles. The tadpole is positioned on the ventral side up, and the OCT imaging plane scrolled along the z-axis until the largest mid-lateral portion of the cartilages is visualized. We acquired a set of 3D data. On these coronal sections a line between two points traveling along the mid-corpus of the Meckel’s and ceratohyal cartilage is measured. Then the largest middle and lateral borders along the corpus of the most anterior gill are marked, and the midline length is measured. Quantitative analysis demonstrated reduction in length and area in treated tadpoles on the coronal plane. L: left, (Mann-Whitney test; p < 0.05) (*p < 0.05/**p < 0.01/****p < 0.0001) (Bars represent mean with 95% confidence interval).

