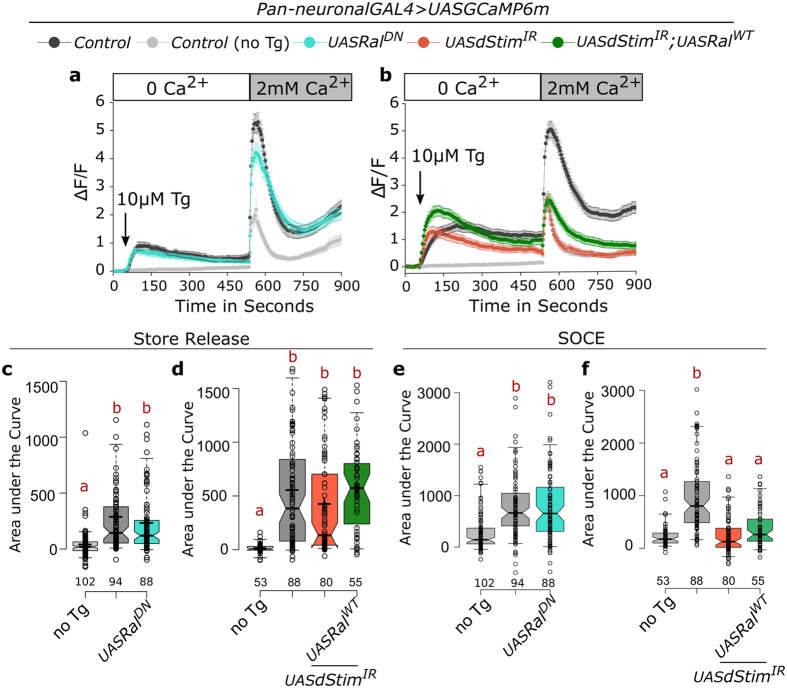
Figure 6. Ral does not mediate SOCE.
(a,b) Traces represent mean (±SEM) of normalized changes in fluorescence (ΔF/F) of the Ca2+ sensor GCaMP6m over the indicated time periods. Fluorescence measurements were from cultured pupal neurons of the indicated genotypes. Treatment with thapsigargin (Tg) leads to passive release of ER store Ca2+ and extracellular addition of Ca2+ results in Store-operated Ca2+ entry or SOCE. (c,d) ER-store Ca2+ release, as estimated by area under the curve from 60 to 540 seconds represented as box plots. (e,f) SOCE, estimated by the area under the curve from 541 to 900 seconds is represented as box plots for the indicated genotypes. In the box plots, centre lines show the medians, crosses indicate the means, box limits indicate the 25th and 75th percentiles, whiskers extend to the 5th and 95th percentiles, individual data points are represented as open circles and the numbers below represent the n for each box. Notches represent 95% confidence interval for each median. Red alphabets over the box plots represent statistically indistinguishable groups (one-way ANOVA with a post hoc Tukey’s test p < 0.05).

