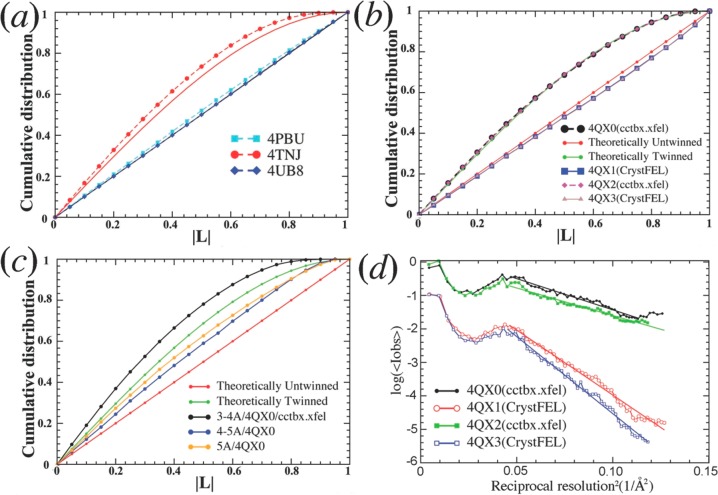
Figure 4.
L-test plots for selected SFX data sets. (a) L-test results for data sets of PSII XFEL data are compared for 4PBU (processed with CrystFEL), 4TNJ (cctbx.xfel), and 4UB8 (mosflm/scala). (b) L-test results for data sets obtained for proteins other than PSII. Data processed using cctbx.xfel (4QX0 and 4QX2) appear to be maximally twinned, whereas data processed from the same crystals using CrystFEL (4QX1 and 4QX3) do not. (c) The cctbx.xfel-processed 4QX0 data set is divided into three resolution ranges for L-test: (i) below 5 Å (orange), (ii) between 5 and 4 Å (blue), and (iii) between 4 and 3 Å (black). (d) Comparison of the Wilson plots (logarithm mean intensity versus inverse resolution squared) obtained from two cctbx.xfel processed data sets (black/4QX0 and green/4QX2) and two otherwise similar data sets processed using CrystFEL (red/4QX1 and blue/4QX3) from similar crystals.

