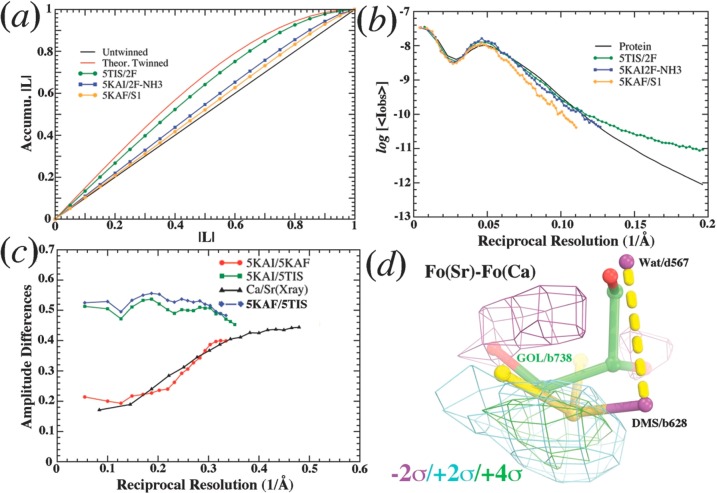
Figure 5.
An analysis of Young et al. (2016) data sets.52 (a) L-test for 5TIS (green), 5KAF (gold), and 5KAI (blue) data sets. Untwinned line is shown in black, and theoretically twinned curve is in red. (b) Wilson plot for 5TIS (green), 5KAF (gold), and 5KAI (gold) data sets after all data sets were scaled to 5KAF and placed on the same absolute scale, i.e., logarithms of mean intensity as a function of reciprocal resolution squared. For comparison, the corresponding plot for all protein data sets in the PDB is shown in black. (c) Amplitude differences as a function of reciprocal resolution between 5KAI and 5KAF (red), between 3ARC and 4IL6 (black), between 5KAI and 5TIS (green), and between 5KAF and 5TIS (blue). (d) Isomorphous difference Fourier maps between Sr and Ca data set contoured at +2σ (cyan), + 4σ (green), and −2σ (magenta) show the largest features for the replacement of a glycerol (b738) by DMSO (DMS/b628) and a water molecule (d567).

